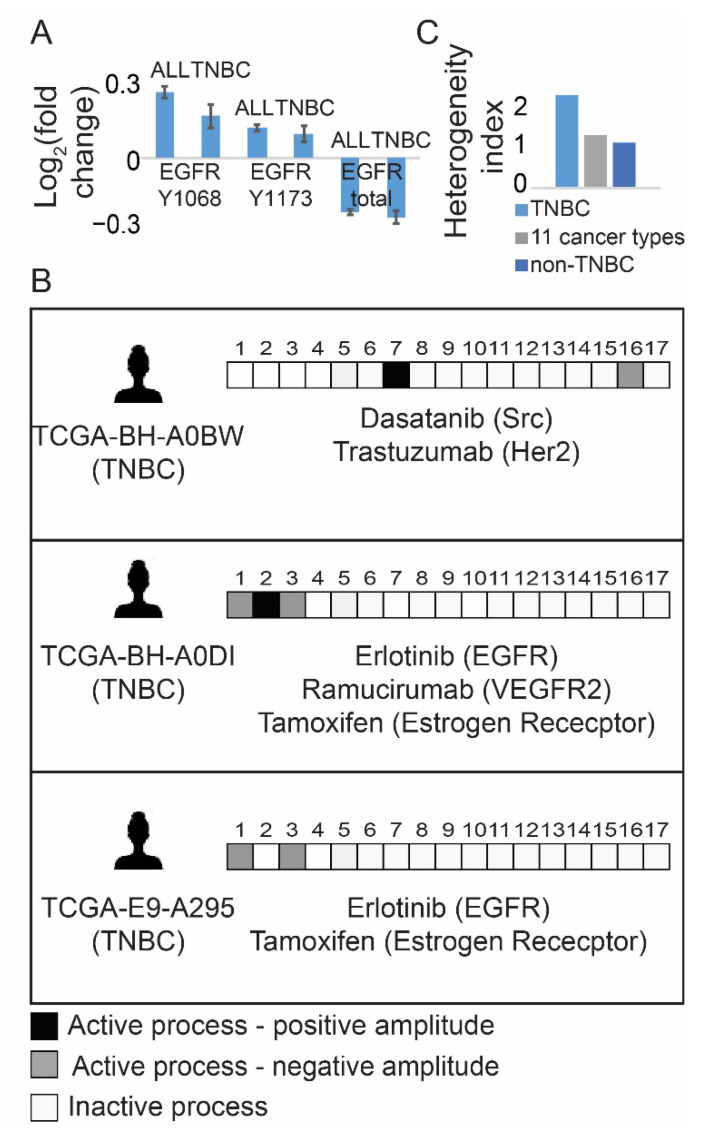
Figure 1.
TNBC tissues are represented by different patient-specific signaling signatures, majority of which do not include EGFR. (A) Fold changes in expression levels of EGFR and pEGFR in TNBC and non-TNBC tumors are shown. Y1068 and Y1173 are EGFR phosphorylation sites; (B) Examples for patient-specific sets of active unbalanced processes are shown. Each sample harbors a set of 1–3 active unbalanced processes (PaSSS), represented schematically by a barcode. In each barcode active unbalanced processes are represented by black or gray squares, inactive white. Negative/positive amplitude denotes how the patients are correlated with respect to a particular process. Suggested PaSSS-based therapies appear below each barcode; (C) Heterogeneity index of 3 subgroups, represented by a ratio between the number of distinct PaSSSs and the number of samples in each subset, is shown for the TNBC subset of tissues, the entire set (3467 samples from 11 cancer types) and the subset of non-TNBC samples. (Abbreviations: TNBC—Triple Negative Breast Cancer, PaSSS—Patient-specific signaling signature, EGFR—Epidermal Growth Factor Receptor, VEGFR2—Vascular Endothelial Growth Factor Receptor 2, Her2—Human Epidermal growth factor Receptor 2, Src—Proto-oncogene tyrosine-protein kinase Src).

