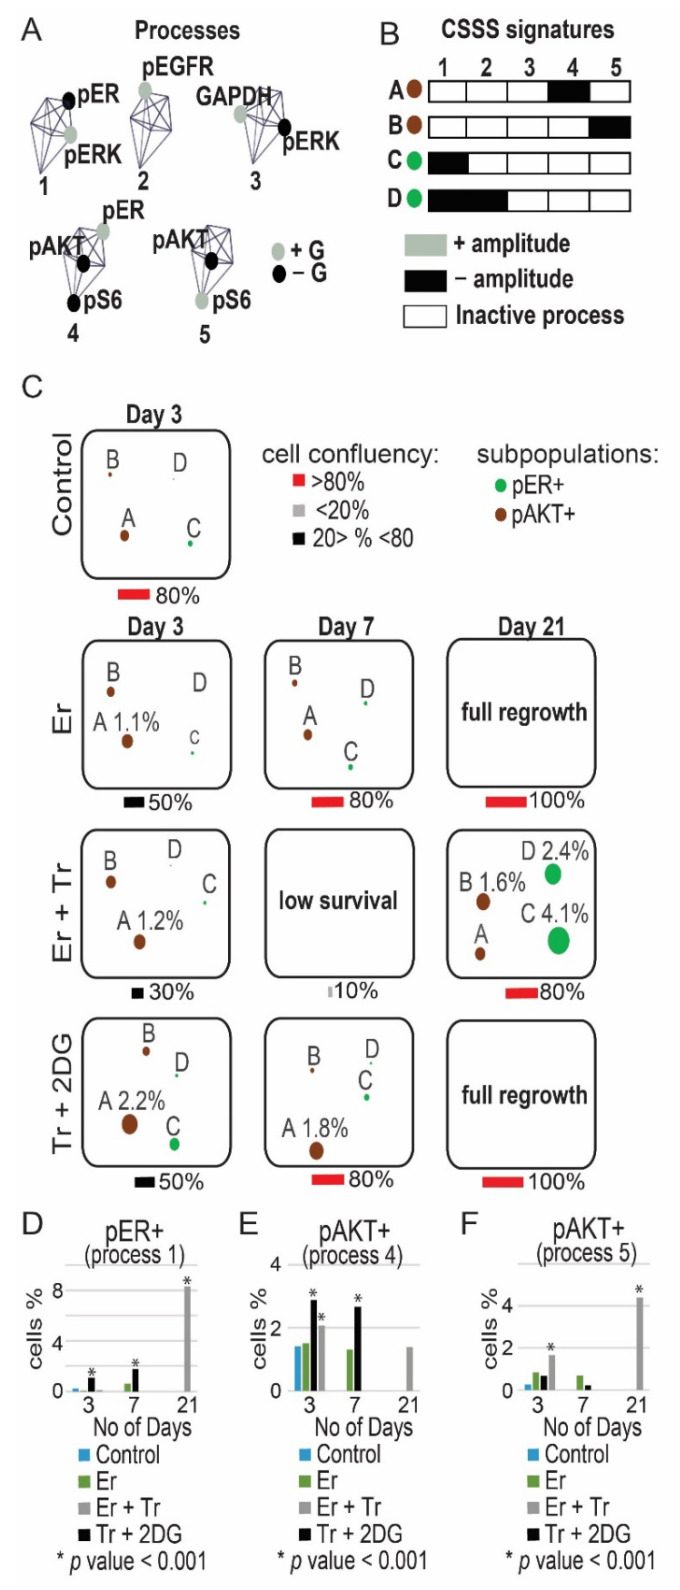
Figure 4.
Map of the evolutionary trajectory of MDA-MB-468 cells revealed a switch in signaling state following partial treatments. MDA-MB-468 cells were treated with Er monotherapy/combination of drugs (Er + Tr, Tr + 2DG) for 72 h and allowed to regrow. Then CSSS analysis of single-cell flow cytometry data was performed to map subpopulations that expand in response to different treatments. Cell-specific signaling signature (CSSS) was assigned to each cell which divided the tumor mass into distinct cellular subpopulations. Subpopulations of cells with pAKT+ and pER+ processes, comprising more than 1% in any of the experimental conditions, are presented and quantified. (A) 5 unbalanced processes, as identified by the analysis, with the central proteins (those having most significant G values, representing the extent of the participation of a protein in each process) are shown. Proteins colored black are anti-correlated with those colored grey. (B) Cells with the same set of unbalanced processes (CSSS) are grouped into subpopulations as represented by different barcodes. Active processes are labeled by either black or grey colors. Each barcode (subpopulation) is then color-coded and presented in (C). Proteins labeled in black in (A) are induced in black processes (B). Proteins labeled in grey in (A) are induced in grey processes (B); (C) The evolution of each subpopulation was then followed over time. The size of the circle represents the percentage of each subpopulation; (D–F) Overall percentage of pER+ and pAKT+ cells was quantified for each treatment. Quantification of the subpopulations was performed using at least ~30,000 cells from each condition, which were obtained from at least 3 wells and from at least 2 independent experiments for each time point. p-values for each treatment vs. control are presented. (Abbreviations: Er—Erlotinib, Tr—Trametinib, 2DG—2 deoxyglucose, pEGFR—phospho Epidermal Growth Factor Receptor, pER—phospho Estrogen Receptor, pAKT—phospho Protein kinase B, pS6—phospho Ribosomal protein S6, GAPDH—Glyceraldehyde 3-phosphate dehydrogenase, pERK—phospho Extracellular signal-regulated kinase, CSSS—Cell-specific signaling signature).

