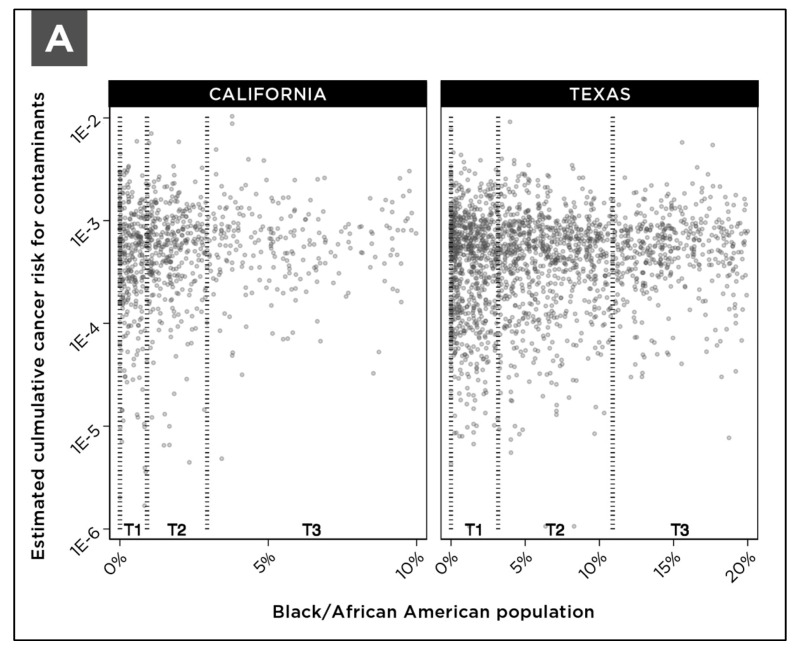
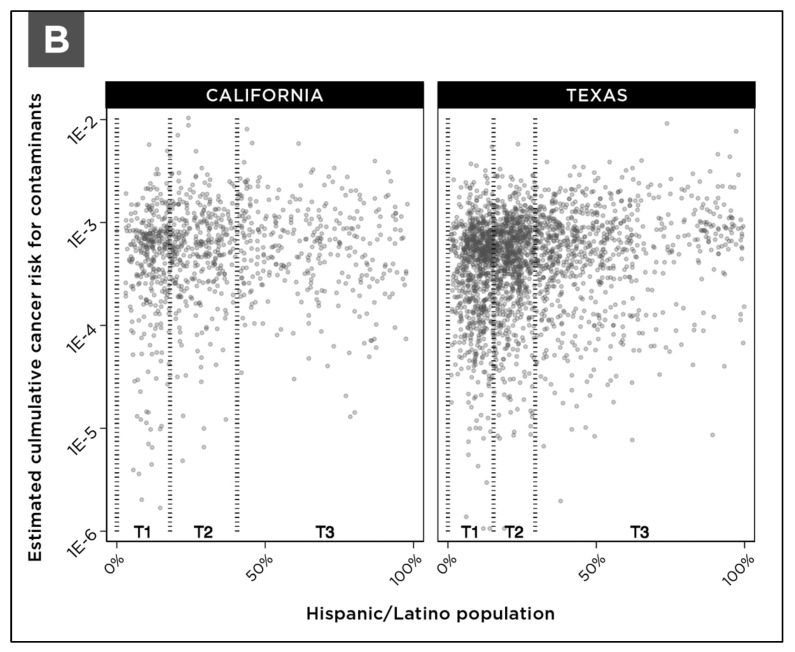
Figure 8.
Distribution of cumulative cancer risk for community water systems in California and Texas divided into terciles according to the (A) percentage of the population that is Black/African American and (B) percentage of the population that is Hispanic/Latino within each system’s service area. The figure includes all systems in each state serving populations greater than 500 people. Terciles are indicated as T1, T2, and T3, and tercile boundaries are listed in Appendix A, Table A3.


