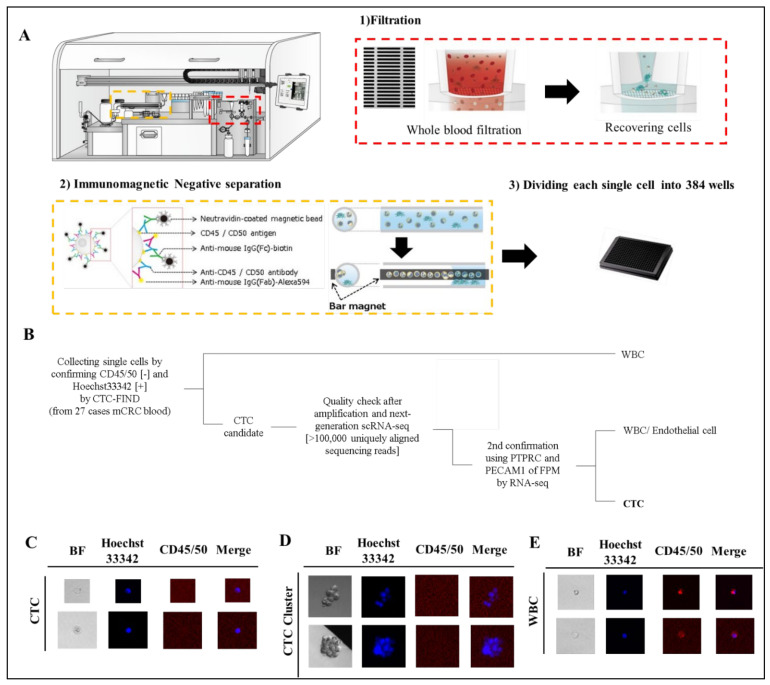
Figure 2.
Separation of CTCs and leukocyte or endothelial cells. (A) Technical concept using CTC-FIND for single cell isolation. (B) Scheme of cell classification. (C–E) Representative fluorescence image of CTCs detected in clinical blood specimens. The blood samples (8 mL) collected from patients with mCRC were evaluated by fluorescence microscopy after separation to single cells by CTC-FIND. Specimens were enriched and stained with Hoechst 33342 (pseudo colored blue) and negative markers composed of anti-CD45 and anit-CD50 antibodies (pseudo colored red), followed by the acquisition of fluorescence images for each marker and digital overlay of the two images (merge). Hoechst 33342-positive and CD45/50-negative CTCs were counted and collected from each specimen. Gallery of CTCs (C), CTC clusters (D) and leucocytes (E). Original magnification, ×500.

