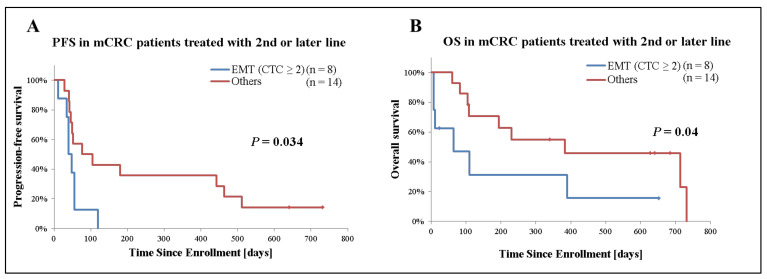
Figure 4.
Kaplan–Meier plots of 22 mCRC cases receiving second- or later-line treatment stratified by presence of EMT CTCs. (A) Analysis of progression-free survival (PFS), (B) overall survival (OS). Patient receiving second- or later-line of treatment were grouped based on the presence and number of EMT CTCs. Patients who only had detectable EMT CTCs and 2 or more CTCs were categorized as “EMT (CTC ≥ 2)”. ‘Others’ indicates patients with <2 EMT CTCs or no detectable CTCs. p-values were calculated with the Generalized Wilcoxon test and are shown in the graph.

