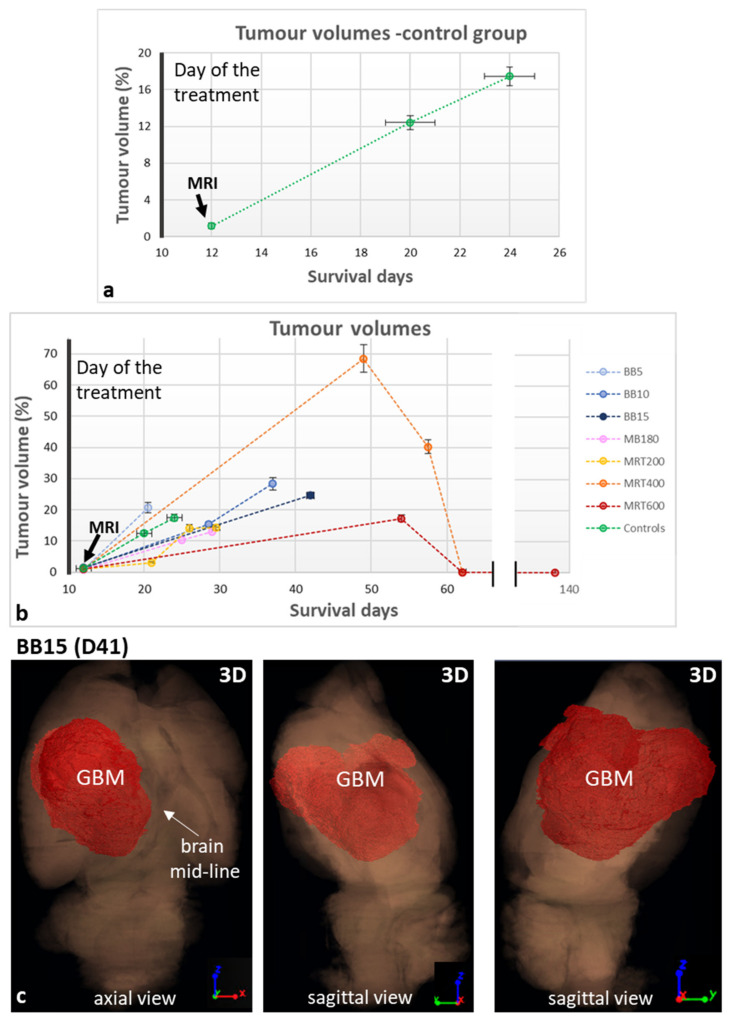
Figure 6.
Quantification of tumor volumes for the GBM-control group (a) and all the groups involved in the study (b) as a function of the survival days which are counted starting from the tumoral cells implantation day (D0). All the values are extracted from XPCI-CT images but the one at day 12, which is in-vivo MRI-based. Tumor volumes are given as a percentage of the entire brain volume; values of animals belonging to the same group with survivals within three days are averaged and the mean values are reported in the graphs. (c) Reports three different orientations (axial and two different sagittal views) of the 3D rendering of a BB15 irradiated rat brain showing how the tumor develops into the brain volume shifting the brain mid-line. The full organ dataset is rendered in semi-transparency while the tumor is colored in red and co-registered as a solid mass.

