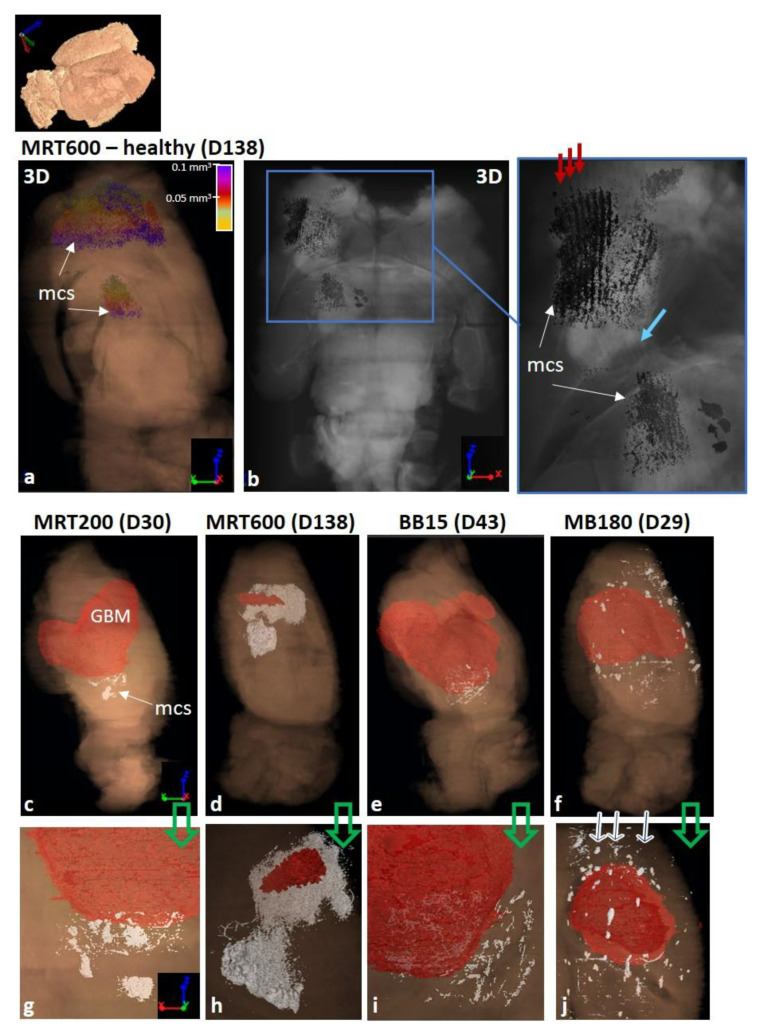
Figure 8.
(a,b) Three-dimensional (3D) images of the distribution of microcalcifications (mcs) for a healthy MRT600-treated sample in a sagittal and axial view, respectively. The (d) zoom enhances that microcalcifications are distributed along the MRT paths (red arrows) and the green arrow points out that the MRT paths are bended along their track. (c–f) The tumor and microcalcifications 3D rendering, in a sagittal view, within the entire brain organ for an MRT200, MRT600, BB15 and MB180 - irradiated sample respectively. (g–j) The zoomed rendering, in axial view, of (c–j) respectively. All tumor and brain volumes are presented in semi-transparency while microcalcifications are co-registered to the other volumes as solid white deposits.

