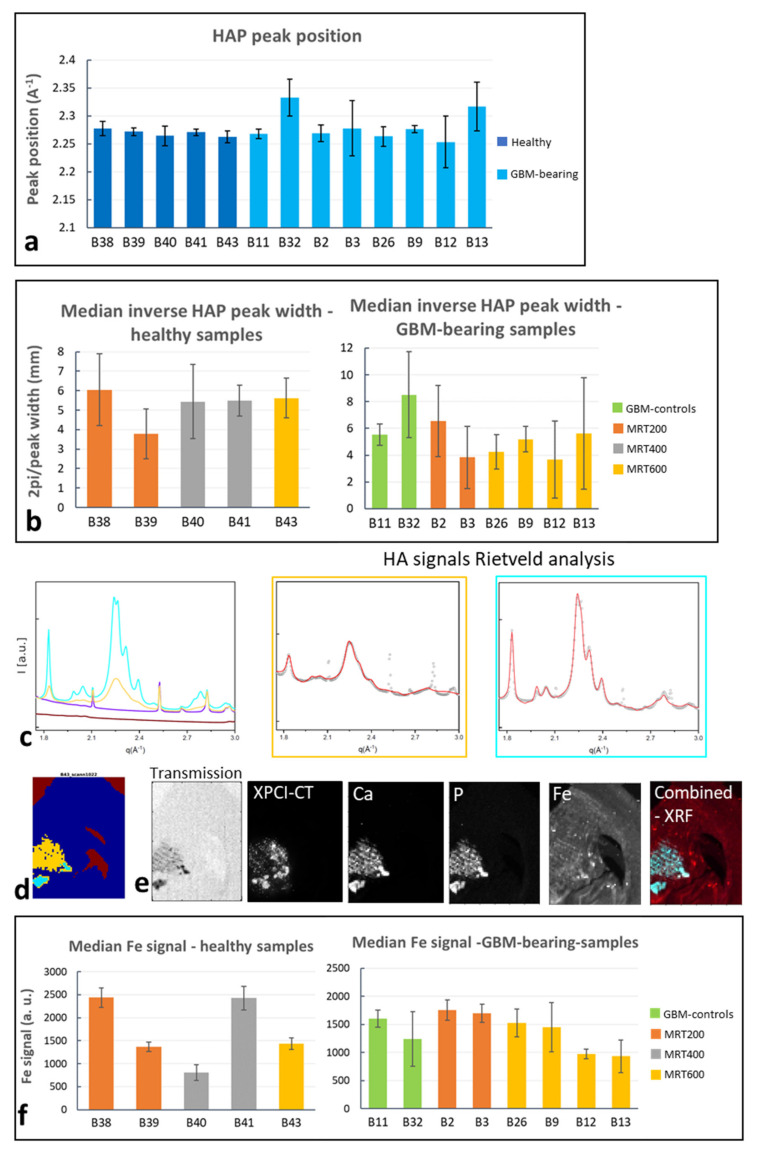
Figure 9.
SAXS/WAXS and XRF data analysis for controls and MRT-treated samples. (a) Peak position graph of the samples showing hydroxyapatite (HAP) as crystallized phase for the Ca content. (b) Inverse peak width for healthy and GBM-bearing MRT-treated brains. The reported value is the median over all the detected signals within the q-range from 2.20 Å−1 to 2.34 Å−1. (c–e) Signal classification, showcase the presence of two different populations of HAP within the same sample, which is revealed by the two WAXS signals, the yellow and cyan one, in (c) that are also displayed with their Rietveld analysis. Here, the crystalline domains evaluated along the 002 direction are 11.7 and 27.0 nm. The colored micrograph (d) helps in identifying the sample areas associated with the detected WAXS signals. (e) The micrographs obtained for the same specimen, for transmission, XPCI-CT, Ca, P, Fe and combined XRF signals. (f) Mean XRF Fe signal for all the available samples. Fe signal was only studied in the image pixels where a relevant XRF Ca signal is detected.

