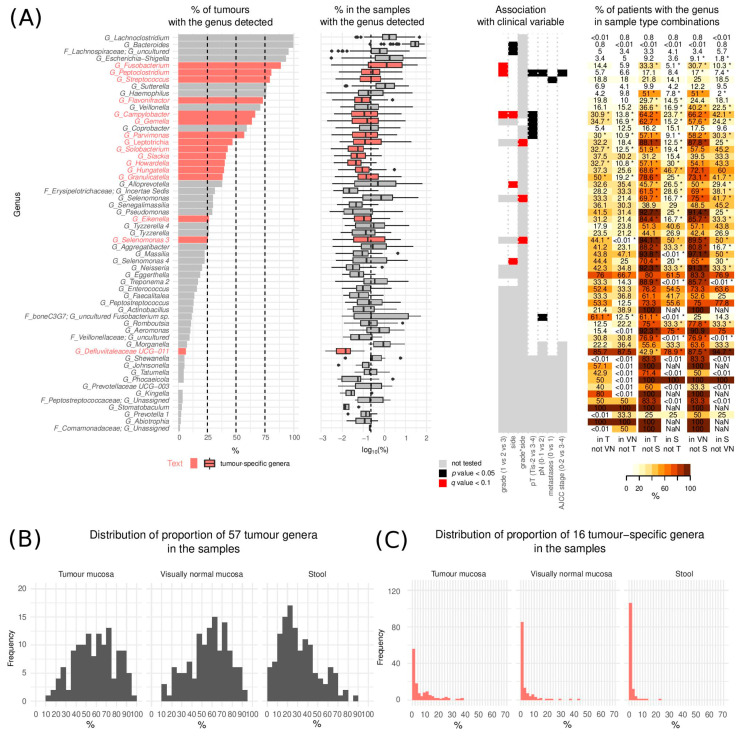
Figure 2.
Tumour genera. (A) (left) Proportion of tumours with the genera detected and distribution of their respective relative abundances (in %) in the samples where they were detected (middle) and association of the bacteria with clinical variables (right). The vertical dashed line represents the median relative abundance of all 264 detected genera (median = 0.24%). The boxplot middle vertical line represents median, the box represents the interquartile range (IQR), the whiskers extend to +/−1.5 IQR. The black dots refer to outliers. (B) Overall proportion of the 57 tumour genera in the three sample types (n = 127) (C) Overall proportion of the 16 tumour-specific genera in the three sample types (n = 127). (Tis—Tumour in situ, pT—tumour pathologic stage, pN—regional lymph nodes pathologic, T—tumour swabs, VN—visually normal mucosa swabs, S—stool, NaN—not a number). * p < 0.05.

