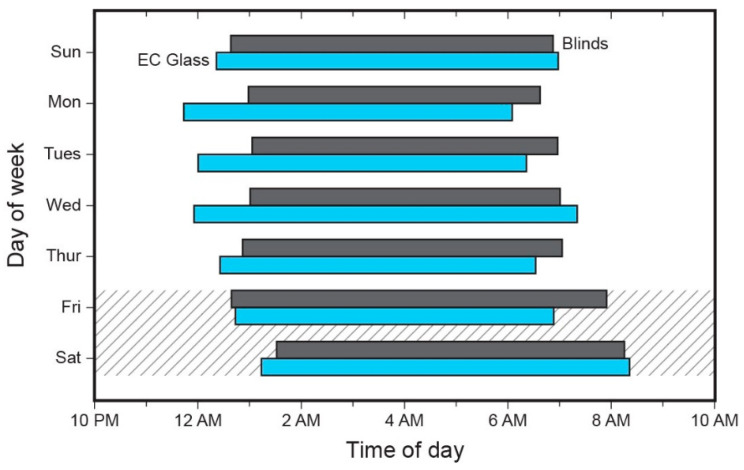
Figure 3.
Actigraph-recorded mean sleep timing during intervention weeks, by day of week. The start of the bar (left) represents mean sleep onset time across the 20 participants, while the end of the bar (right) represents the mean wake time. The cross-hatched area represents weekend night sleep periods.

