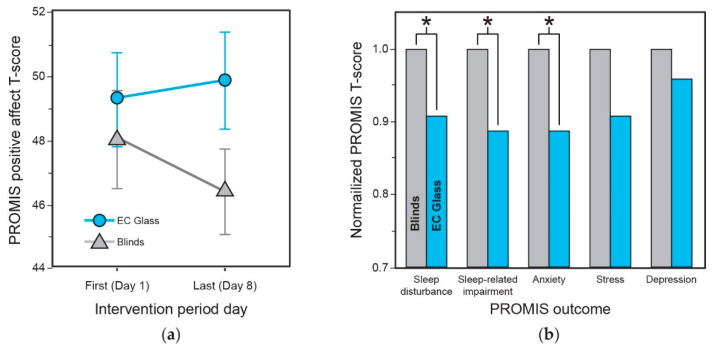
Figure 7.
(a) PROMIS Positive Affect I5a instrument score (T-score) over the course of the week (start = Day 1 to end = Day 8) in the EC Glass versus Blinds conditions. (b) Normalized results of the linear mixed effects model comparing the PROMIS statement subscore (scale of 1–5) across interventions for sleep disturbance (p = 0.036), sleep-related impairment (p = 0.049), anxiety (p = 0.023), stress (p = 0.075), and depression (p = 0.30). Lower normalized PROMIS T-scores represent improved values in these outcomes. p-values indicate results of the within-subjects linear mixed effects model, x-axis describes scale statements assessed for each PROMIS instrument. (Statistical significance: * represents p ≤ 0.05.)

