
Figure 3.
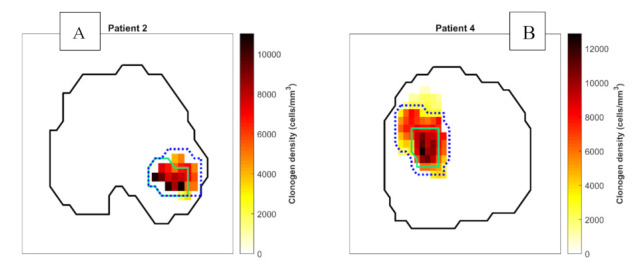
Axial images showing hypoxic sub-volumes within the prostate (black) for patient 2 (A) and patient 4 (B) representing the smallest and largest tumour volumes of the study cohort respectively. The volumes containing 20% and 80% of hypoxic voxels are represented by green solid lines and blue dotted lines, respectively. Note this is a 2-dimensional representation of a 3D volume.