FIG. 6.
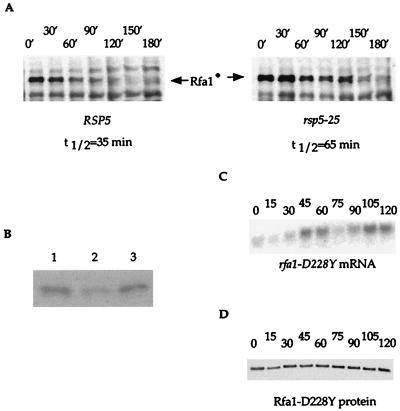
Protein stability and mRNA levels of rfa1-D228Y. (A) A protein blot analysis of the stability of Rfa1-D228Y in the RSP5 and rsp5-25 mutant strains was performed. Rfa1-D228Y protein is tagged with HA and is indicated on the blots as Rfa1•. Other bands are due to background obtained with the HA antibody. The half-lives were calculated as described in Materials and Methods. (B) Protein levels of Rfa1-D228Y in rfa1-D228Y strains overexpressing rfa1-D228Y (lane 1) and rfa1-D228Y rsp5-25 strains (lane 3) were compared by a protein blot analysis. rfa1-D228Y strains (lane 2) were included as a control. (C and D) Measurement of mRNA and protein levels in rfa1-D228Y strains during the cell cycle. To measure mRNA and protein levels of rfa1-D228Y during the cell cycle, cells were released from alpha-factor arrest, samples were taken every 15 min, total mRNA was extracted, and total yeast protein extracts were prepared as described in Materials and Methods. (C) RNA blots were performed by using an internal fragment of RFA1 as a probe and URA3 as a loading control. The mRNA levels for URA3 were unchanged (data not shown). (D) Protein blot analysis was performed by using Rfa1 antibody. As a control, the same blot was reprobed with Rsp5 antibody. No variation in Rsp5 protein levels was detected (data not shown). After release from arrest, cells with small buds started to appear at 30 min and peaked at 45 min for the first cell cycle. The peak for cells with small buds for the second cell cycle occurs at 105 min.

