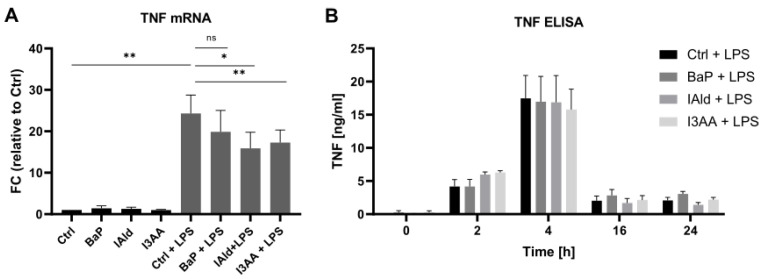
Figure 2.
TNF expression and secretion. Macrophages were activated with 100 ng/mL LPS in the presence or absence of the AhR-ligands BaP, IAld, or I3AA. (A) The mRNA expression was determined by qPCR after 6 h of treatment. Data were normalized to RPLP0, and the gene expression level was calculated relative to the unstimulated control. Data are shown as mean ± SEM (n = 4). Significances were calculated by a two-sided, paired t-test (* p ≤ 0.05; ** p ≤ 0.01; ns, not significant). (B) Secreted TNF was determined by ELISA after 0, 2, 4, 16, and 24 h of treatment. Data are shown as mean ± SEM (n = 6 for 2 h and 4 h, n = 5 for 0 h, 16 h, and 24 h).

