
Figure 3.
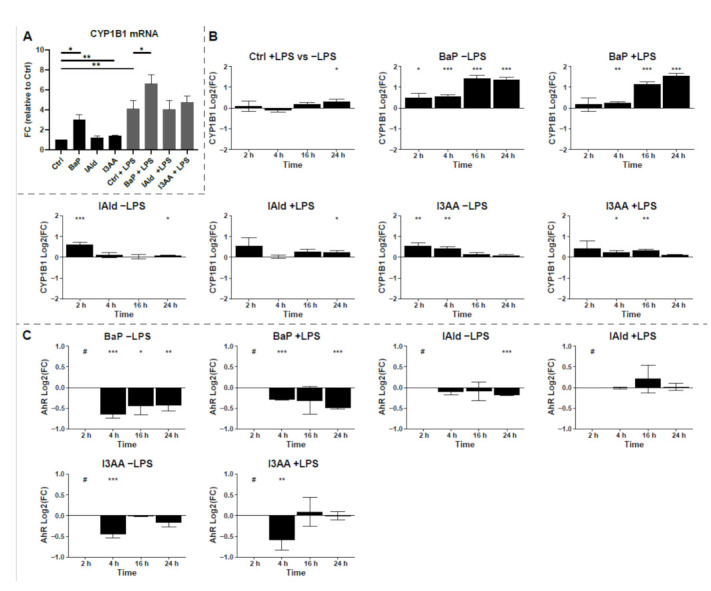
Induction of CYP1B1. (A) mRNA expression of CYP1B1 was determined by qPCR after 6 h of treatment. Data were normalized to RPLP0, and the gene expression level was calculated relative to the unstimulated control. Data are shown as mean ± SEM (n = 5). Significances were calculated by a two-sided, paired t-test. (B) Relative protein abundances of CYP1B1 compared to untreated control samples or LPS-treated control samples for co-treatment are shown as Log2(FC) over time. Macrophages were stimulated with 100 ng/mL LPS or the AhR-ligands BaP (2 µM), I3AA (50 µM), and IAld (50 µM) with or without additional LPS for 2, 4, 16 and 24 h. (C) Relative protein abundances of AhR compared to untreated control samples or LPS-treated control samples for co-treatment are shown as Log2(FC) over time. Macrophages were stimulated the AhR-ligands BaP (2 µM), I3AA (50 µM), and IAld (50 µM) with or without additional 10 ng/mL LPS for 2, 4, 16 and 24 h. The significances were determined by student’s t-test (n = 6 for 2 h and 4 h, n = 5 for 16 h and 24 h). (* p ≤ 0.05, ** p ≤ 0.01, *** p ≤ 0.001, # below limit of detection for this time point).