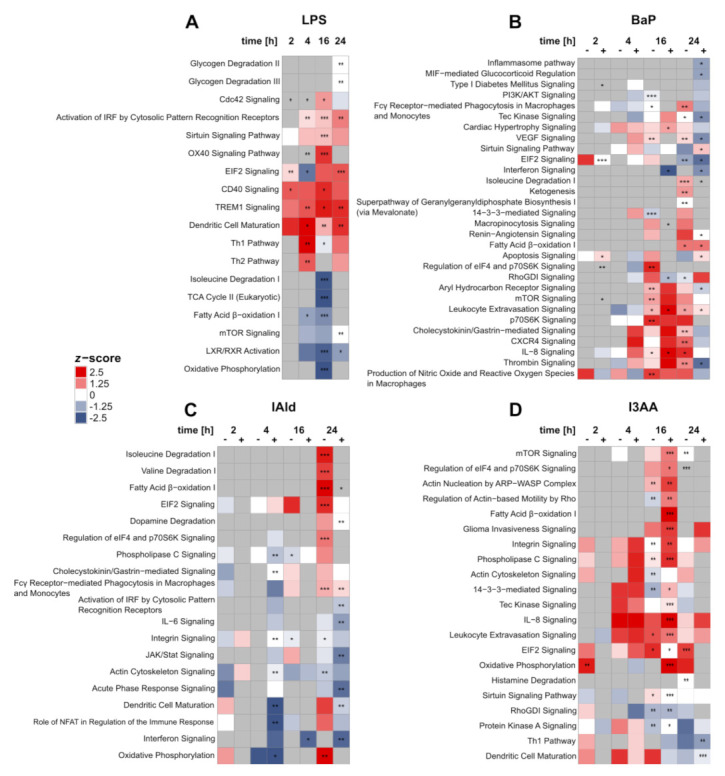
Figure 5.

Changes in IPA core pathways over time after treatment with LPS (A), BaP (B), I3AA (C), and IAld (D), each with (+) or without (–) LPS co-stimulation and compared with the corresponding control samples (either with or without LPS). Regulation of pathways was identified by z-scores. Regulated pathways were marked either red (up, z-score > 0) or blue (down, z-score < 0). The significance of enrichment was determined by Fisher’s Exact t-test, Benjamini-Hochberg adjusted, and indicated with asterisks: adjusted p-value ≤ 0.05 (*); adjusted p-value ≤ 0.01 (**); adjusted p-value ≤ 0.001 (***) (n = 6 for 2 h and 4 h, n = 5 for 16 h and 24 h).
