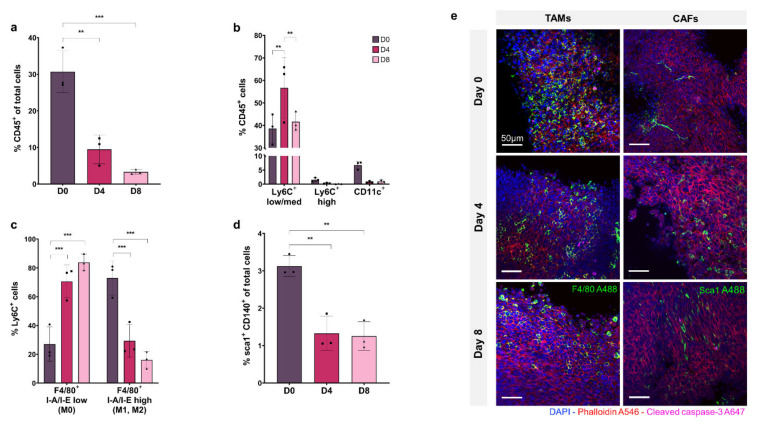
Figure 2.
Flow cytometry analysis and fluorescent microscopy of organotypic slices cellular sub-populations at day 0, 4, and 8. (a) CD45+ immune cells as a % of total cells. (b) Breakdown of mononuclear phagocyte cells as a % of CD45+ population with Ly6C+ low/med macrophages, Ly6C+ high monocytes, and CD11c+ dendritic cells. (c) Breakdown of Ly6C+ F4/80+ I-A/I-E low non-activated macrophages and F4/80+ I-A/I-E high activated macrophages (M1, M2). (d) sca1+ CD140+ CAFs as a % of total cell population. (e) Organotypic slices labelled with DAPI (nuclei, blue), phalloidin (F-actin, red), cleaved caspase-3 (apoptosis, pink), and F4/80 (macrophage marker, green) or sca1 (CAF marker, green). Data is expressed as Mean ± SD of n = 3 samples. p-values; ** p ≤ 0.01, *** p ≤ 0.001.

