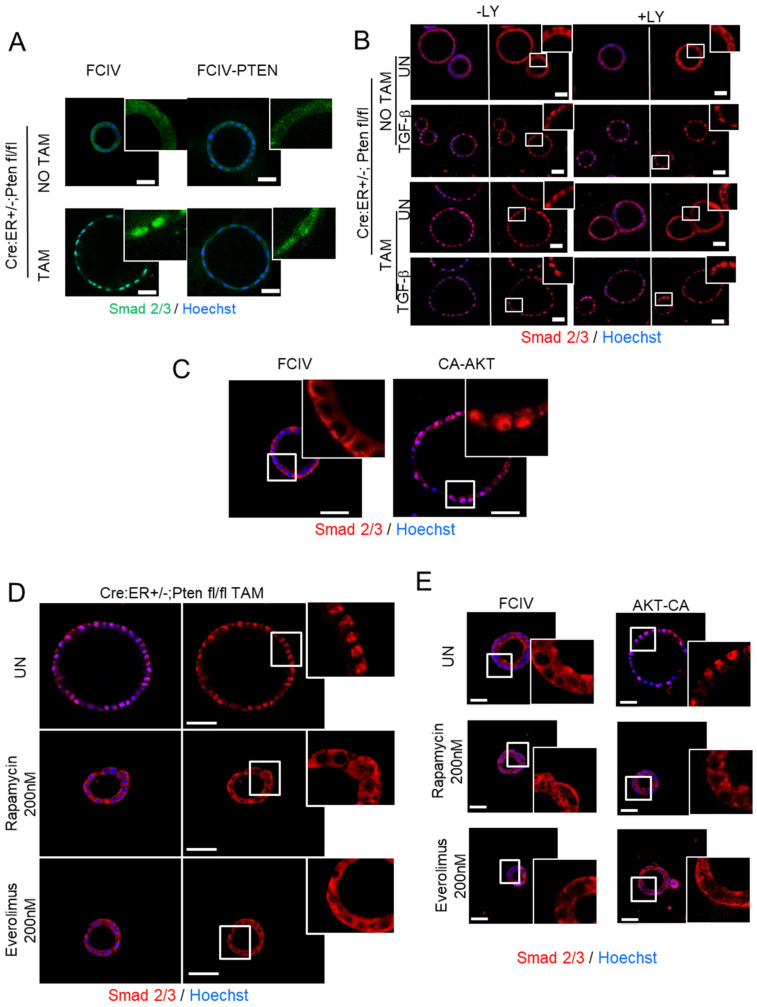
Figure 4.
PI3K/AKT/mTORC1 inhibition restores cytosolic localization of SMAD2/3. (A) Representative images of SMAD2/3 immunostaining on Cre:ER+/−;PTENfl/fl 3D cultures treated (TAM) or not (NO TAM) with tamoxifen and infected with lentiviruses carrying PTEN cDNA (FCIV-PTEN) or the empty vector (FCIV). Nuclei were evidenced with Hoechst staining. Data are from n = 3 experimental replicates (independent 3D cultures). Scale bars: 25 μm. (B) Representative images of SMAD2/3 staining on Cre:ER+/−;PTENfl/fl organoids treated (+LY) or not (-LY) with LY294002 10 µM and stimulated or not (UN) for 30 min with TGF-β with 10 ng/mL. Images of framed regions were magnified to evidence SMAD2/3 cellular localization. Data from n = 3 experimental replicates (independent organoid cultures). Scale bars: 25 μm. (C) Representative images of SMAD2/3 immunostaining on cells infected with a plasmid encoding a constitutively active AKT (CA-AKT) or the control plasmid (FCIV). Nuclei were evidenced with Hoechst staining. Scale bar 50 µm. (D) Representative images of SMAD2/3 immunostaining on Cre:ER+/−;PTENfl/fl organoids treated (TAM) or not (NO TAM) with tamoxifen and left or untreated (UN) or treated with 200 nM of Everolimus or Rapamycin. Nuclei were evidenced with Hoechst staining. Data from n = 3 experimental replicates (independent organoid cultures). Scale bar 50 µm. (E) Representative images of SMAD2/3 immunostaining on cells infected with a plasmid encoding a constitutively active AKT (CA-AKT) or the control plasmid (FCIV) and treated with 200 nM of Rapamycin or Everolimus or left untreated (UN). Nuclei were evidenced with Hoechst staining. Data from n = 3 experimental replicates (independent organoid cultures). Scale bar 50 µm.

