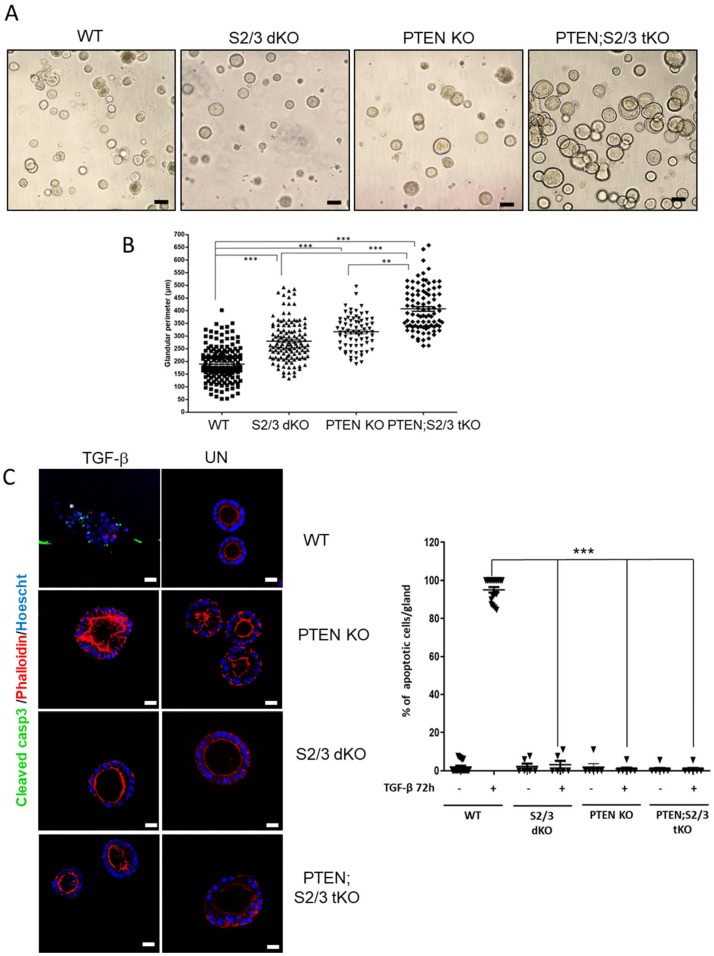
Figure 5.
Nuclear SMAD2/3 constrains cell proliferation caused by PTEN deficiency. (A) Phase contrast pictures and (B) glandular perimeter measurements of Cre:ER−/−;PTENfl/fl;SMAD2fl/fl;SMAD3fl/fl without tamoxifen treatment (WT) or Cre:ER+/−;PTENfl/fl;SMAD2+/+;SMAD3+/+ (PTEN knock-out, PTEN KO), Cre:ER+/−; Pten+/+;SMAD2fl/fl;SMAD3fl/fl (SMAD2/3 double knock-out, S2/3 dKO) and Cre:ER+/−;PTENfl/fl;SMAD2fl/fl;SMAD3fl/fl (PTEN and SMAD2/3 triple knock-out, PTEN;S2/3 tKO) organoid cultures treated with tamoxifen (TAM). Values are mean and error bars represent mean ± s.e.m. ** p < 0.001, *** p < 0.0001 by t-test analysis. Data are shown for three independent experiments (each with n = 150 measured glands per condition). Scale bars: 100 μm. (C) Representative cleaved caspase-3 images (left) and quantification (right) of organoids with same genotypes as in (A) of treated with 10 ng/mL of TGF-β for 48 h or left untreated (UN). Cells were stained with phalloidin to evidence actin cytoskeleton and glandular morphology. To show apoptotic nuclear morphology nuclei were counterstained with Hoechst t. Scale bars: 25 μm. Values are mean and error bars represent mean ± s.e.m. *** p < 0.0001 by t-test analysis.

