Figure 3.
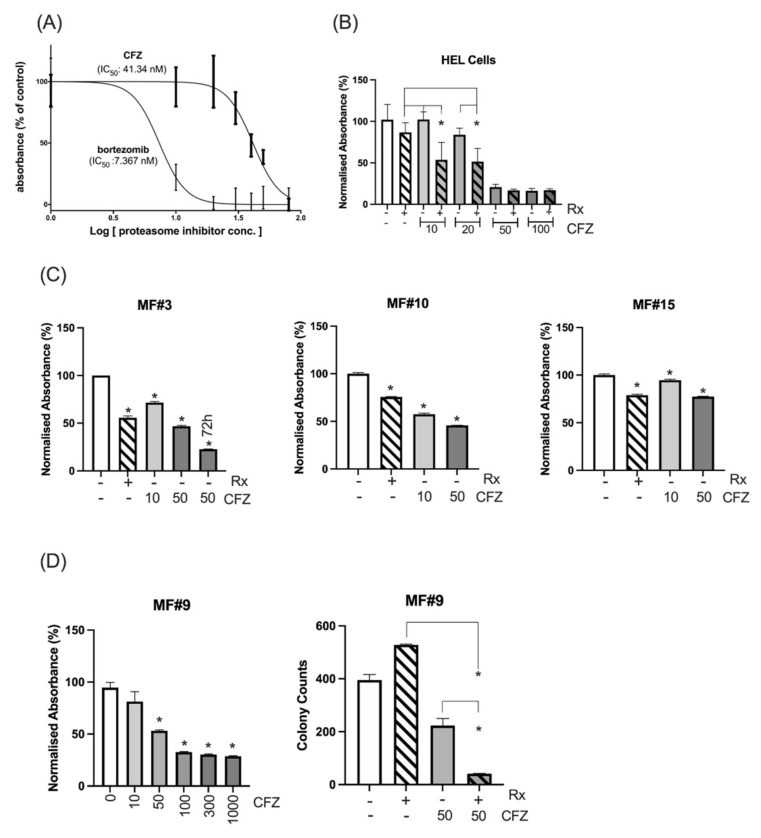
Cell line and primary MF cells’ sensitivity to proteasome inhibitors. (A) The IC50 was measured for CFZ and bortezomib after measuring the proliferation and viability at 72 h using MTS assay. (B) Sensitivity of HEL cells to various doses of CFZ alone or in combination with 300 nM ruxolitinib (Rx). Combination of ruxolitinib with CFZ at 10 or 20 nM significantly increased the inhibition of the HEL cells compared to either ruxolitinib (p value: 0.01 and 0.005 respectively) or CFZ (p value: 0.001 or 0.01 respectively) after 72 h. * represents p value < 0.05 for the comparison between the combination therapy and either treatment. The inhibition at 50 or 100 nM CFZ alone or in combination compared to control was significant. The Y axis represents the normalized absorbance to untreated control. (C) CD34+ cells from 3 MF patients showed sensitivity to 10 and 50 nM CFZ as measured by MTS assay at 24 h (For MF#3 the viability of the cells at 50 nM CFZ was also measured at 72 h). Y axis represents the % of absorbance relative to the untreated control. The columns represent the mean from at least 3 technical replicates (* represents a significant p value in comparison to untreated control). Please see the p values of the comparison between any two conditions in Table S3. (D) (Left) Ruxolitinib resistant triple-negative MF#9 showed sensitivity to CFZ, and this sensitivity became significant at 50 nM (p = 0.0001) with higher doses of CFZ leading to higher suppression as measured by MTS assay at 48 h (results are presented as mean and error bars of at least 3 replicates). The Y axis represents the normalised absorbance of the MTS assay. (Right) Colony formation assay shows CFZ has a significant inhibitory impact on stem/progenitor cells at 50 nM which increased several times in combination with ruxolitinib. The data for each condition was achieved by reading the number of colonies from two dishes (duplicates for each condition) and presented with error bars (*: p value < 0.05).

