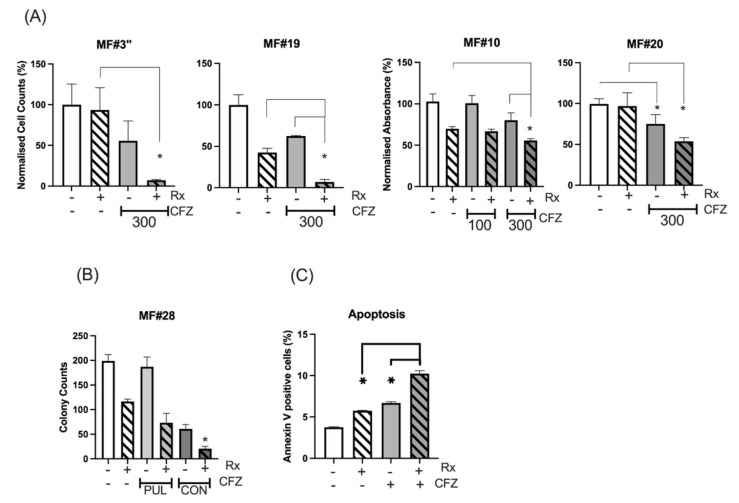
Figure 4.
Continuous and pulsed exposure of MF CD34+ cells to CFZ. (A) CFZ 1h-pulsed exposure potentiated the ruxolitinib effect on the inhibition of cell proliferation or viability of MNC from MF#3”, MF#19 and MF#20 and CD34+ cells from MF#10. The cell count (MF#3” and MF#19) and the MTS assay measurement (MF#10 and MF#20) was performed at 72 h (MF19, MF#20 and MF#10) and at 48 h (MF#3) from pulsed exposure (refer to Figure S3 for experiment description). The Y axis represents the normalised cell counts (MF#3 and MF#19) or normalised absorbance (MF#10 and MF#20) expressed as percentage of the control. Cell viability was significantly reduced with 300 nM 1h-pulsed CFZ compared to untreated control (p value < 0.05). The reduction of cell viability by ruxolitinib was also significant (p value < 0.05) except for MF#3” and MF#20 (* represents p value < 0.05). Please see the p values of the comparison between any two conditions in Table S4. (B) The colony formation assay was set up for CD34+ cells (MF#28) after 24 h of continuous (CON) or 1h-pulsed exposure (PUL) to CFZ and in the presence or absence of ruxolitinib. The data for each condition was achieved by reading the number of colonies from two dishes (duplicates for each condition) and presented with error bars (*: p value < 0.05 comparing ruxolitinib versus combination treatment). (C) The % of apoptotic cells in ruxolitinib, 1h-pulsed CFZ and their combination in MF CD34+ cells at 24 h. This experiment was performed in duplicate and showed both CFZ and ruxolitinib (Rx) to increase apoptosis in the MF cells, with the highest effect obtained with drug combination. The concentration of ruxolitinib (RX) was 300 nM for all the experiments in this figure. The p value for comparing the two conditions was: control versus Rx, p = 0.001; control versus CFZ, p = 0.0004; Rx versus CFZ, p = 0.028; Rx versus Rx+CFZ, p = 0.0001; CFZ versus Rx+CFZ, p = 0.0002.

