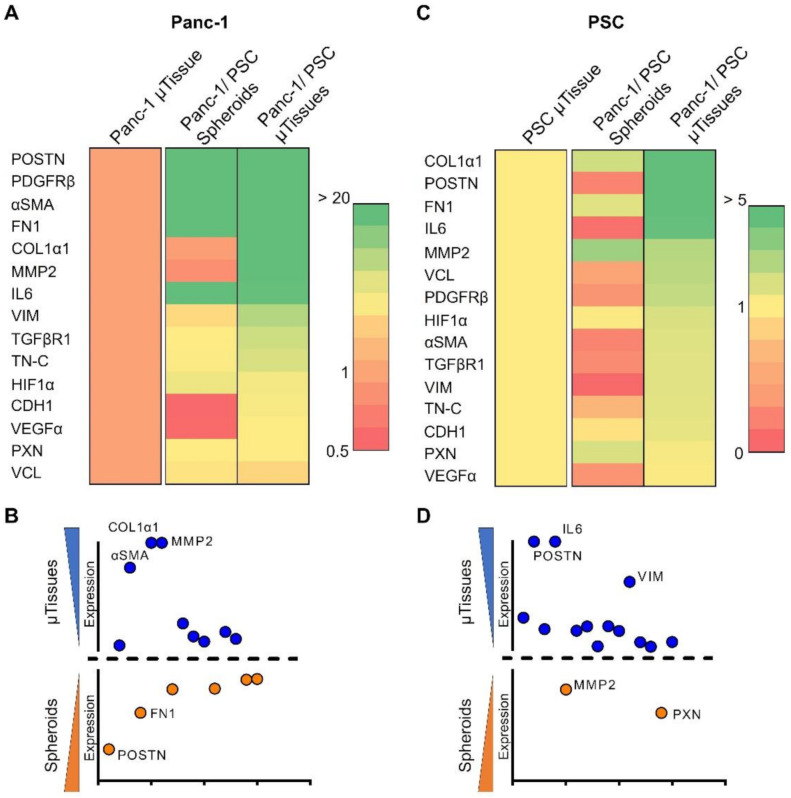
Figure 4.
Gene profile of the interaction between Panc-1 cells and PSCs. (A) Heat map of expressed genes in Panc-1 cancer cells for Panc-1 µtissues, Panc-1/PSC heterospheroids and Panc-1/PSC µtissues. (B) Comparison of Panc-1 gene expression in Panc-1/PSC µtissues versus Panc-1/PSC heterospheroids. (C) Heat map of expressed genes in PSC for PSC µtissues, Panc-1/PSC heterospheroids and Panc-1/PSC µtissues. (D) Comparison of PSC gene expression in Panc-1/PSC µtissues versus Panc-1/PSC heterospheroids.

