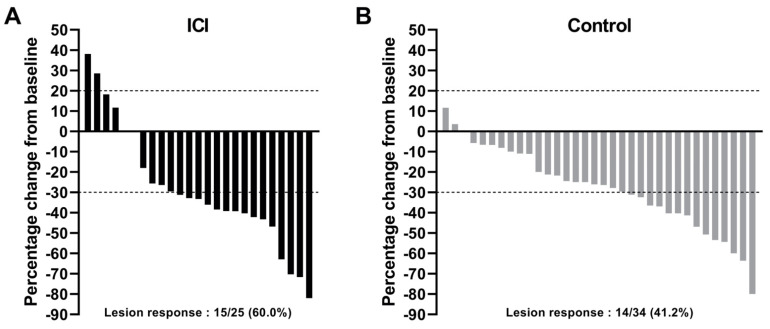
Figure 2.
Waterfall plot of change in target lesion size between baseline and preoperative imaging in the ICI (A) or control (B) group. Lesion size refers to the largest diameter measured on CT-scan in the axial plane. ICI: received preoperative immune checkpoint inhibitors; control group: received standard pre-operative chemotherapy as part of an induction treatment.

