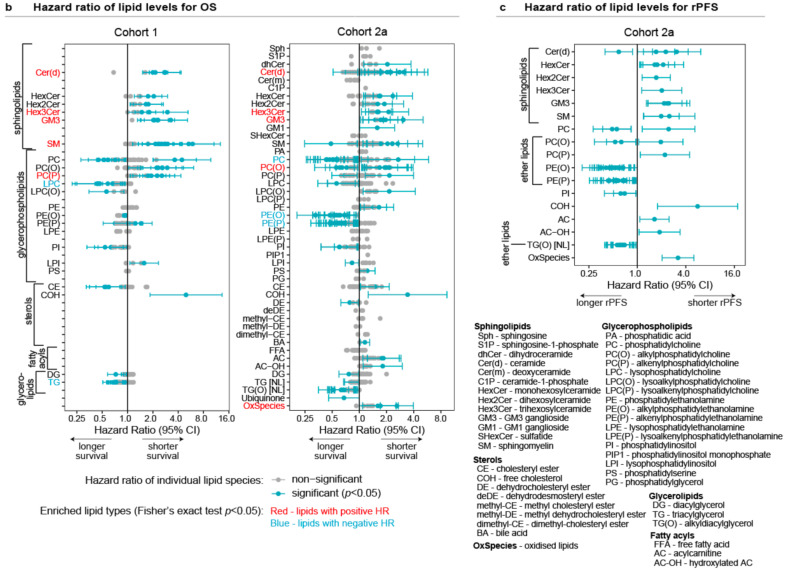
Figure 2.
Prognostic baseline levels of circulating lipids for Cohort 1 and Cohort 2a: (a) Kaplan–Meier curves of the association of the poor prognostic 3-lipid signature (3LS) at baseline with OS. The 3LS consists of Cer(d18:1/24:1), SM(d18:2/16:0), and PC(16:0/16:0); (b) Forest plots of hazard ratios of OS for baseline plasma levels of lipids in both cohorts; (c) Forest plot of hazard ratios of rPFS for baseline plasma levels of lipids significantly associated with rPFS and OS in Cohort 2a.


