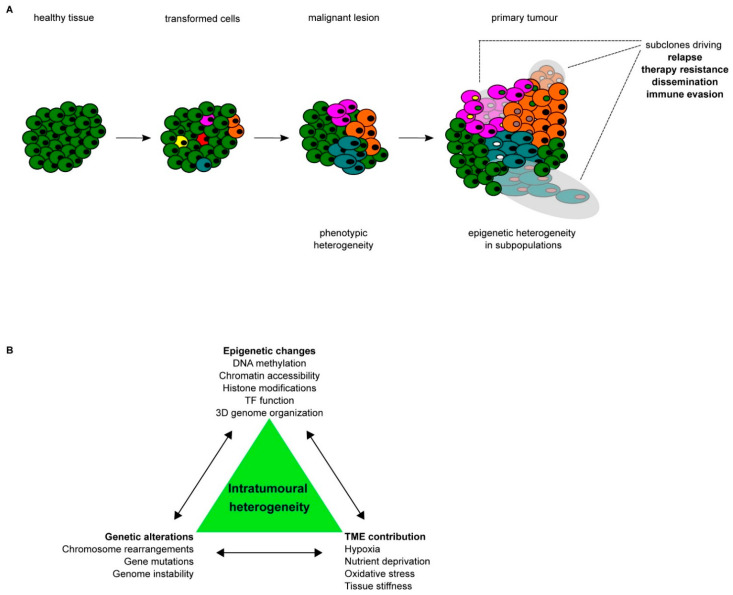
Figure 1.
Tumour development; (A) schematic representation of the stepwise progression from healthy tissue towards a primary tumour, including the increase in heterogeneity on both the phenotypic and epigenetic levels. Different colors of cells indicate different subpopulations within the same tumour bulk, whereas different colors of nuclei indicate epigenetic heterogeneity within the same subpopulation of cancer cells. (B) Schematic summary of the different drivers of intra-tumoural heterogeneity (ITH) and their interconnectivity.

