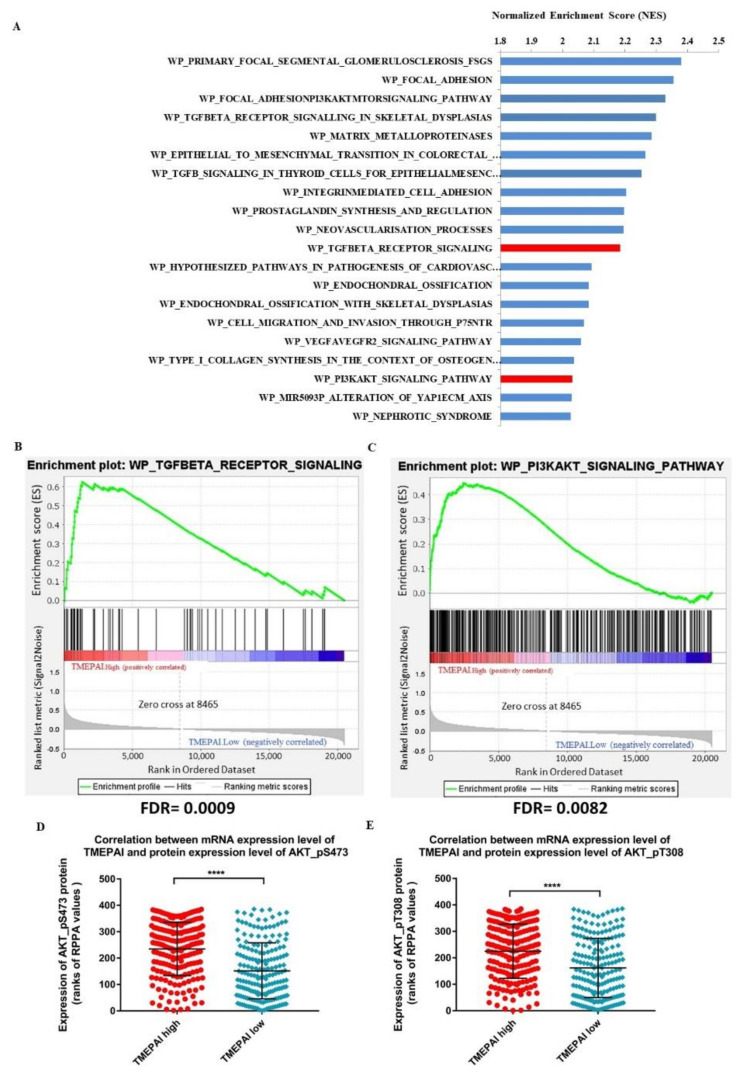
Figure 2.
Association between altered expression of TMEPAI mRNA and AKT Ser473 or AKT Thr308 in TCGA-invasive breast cancer cases. (A), Top biological pathways with the highest normalized enrichment score (NES) identified on gene set enrichment analysis (GSEA) of TMEPAI.High samples (303) compared with TMEPAI.Low samples (303) in TCGA invasive breast cancer cases (BRCA) at FDR q-value < 0.05. (B,C), Enrichment plot of signatures of the TGF-β receptor signaling (B) and PI3K/AKT signaling (C) pathways showing the profile of the running enrichment score and the positions of gene set members on the rank-ordered list of upregulated genes in TMEPAI.High TCGA invasive breast cancer cases (BRCA). (D,E), Comparison of ranks of reverse phase protein array values (RPPA) of AKT Ser473 (D) or AKT Thr308 (E) between TMEPAI.High and TMEPAI.Low samples in cases that have matched single mRNAseq and RPPA samples (193 samples each); Mann–Whitney test, **** p value < 0.0001, figures show Mean ranks and standard deviation.

