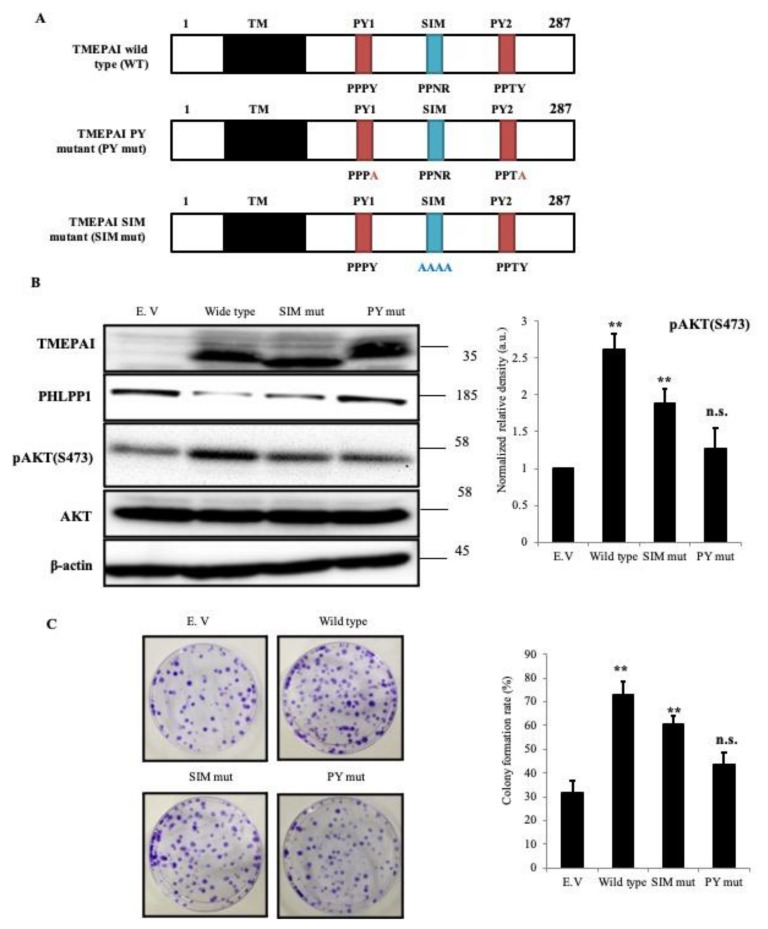
Figure 6.
PY motifs of TMEPAI are required for downregulation of PHLPP1 to sustain AKT phosphorylation. (A), Schematic representation of mutations in SIM and PY motifs of human TMEPAI. (B), Lysates from TMEPAI re-expressed cells were subjected to Western blot analysis to detect TMEPAI, PHLPP1, pAKT(S473), and AKT as indicated. The bar chart depicts the relative densities of the pAKT(S473) bands. (C), The visualized colonies and their respective colony-forming rates are shown. The values presented here are the means ± SDs of 3 independent experiments; p ≤ 0.01 (**), where n.s. means not significant. The uncropped Western Blot images can be found in Figure S6.

