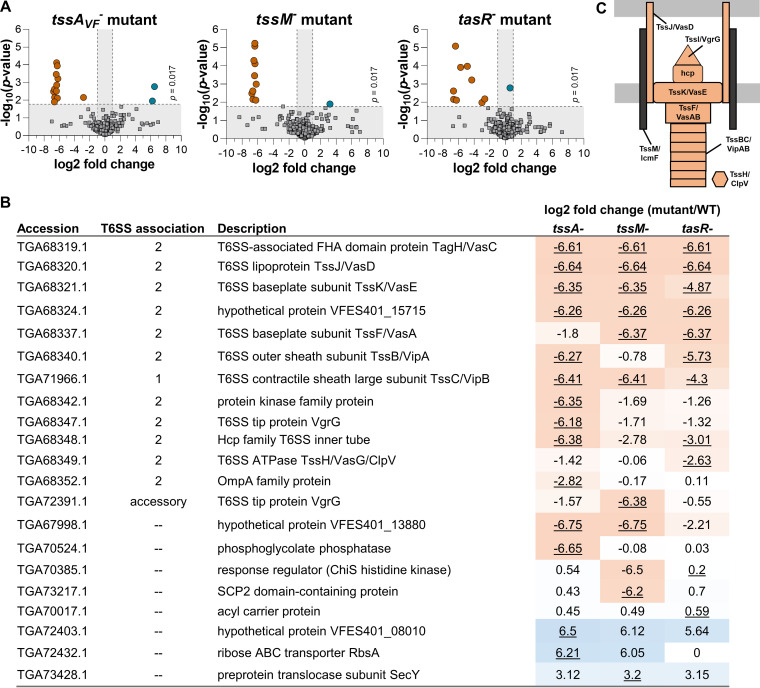
FIG 6.
TssAVF, TssM, and TasR are required to activate expression of T6SS structural proteins in hydrogel. (A) Volcano plots showing the log2 fold difference in protein abundance between the T6SS2 mutant and wild-type ES401. Proteins with a negative log2 fold change are more abundant in wild-type ES401 (left; orange), and proteins with a positive log2 fold change are more abundant in the mutant (right [blue]). Data points above the dashed line had significant P values between treatments (Student's t test with the Bonferroni correction, P < 0.017), and those outside the vertical dashed lines had a magnitude fold change of >1 log2 between treatments. (B) Table describing the log2 fold change (mutant versus WT) of all proteins that were significantly differentially expressed between the mutant and wild type in at least one treatment. Underlined log2 fold change indicates significantly differently expressed compared to the wild type (Bonferroni corrected α = 0.017). NSAF values of zero were replaced with the limit of detection (0.000762) for calculation of log2 fold change values. Heat map colors were assigned expression levels of high (orange) to low (blue) based on log2 fold change values. (C) Structural T6SS2 proteins. Orange indicates that the protein was differentially expressed between wild-type ES401 and at least one of the regulatory mutants (Student's t test with the Bonferroni correction, P < 0.017).

