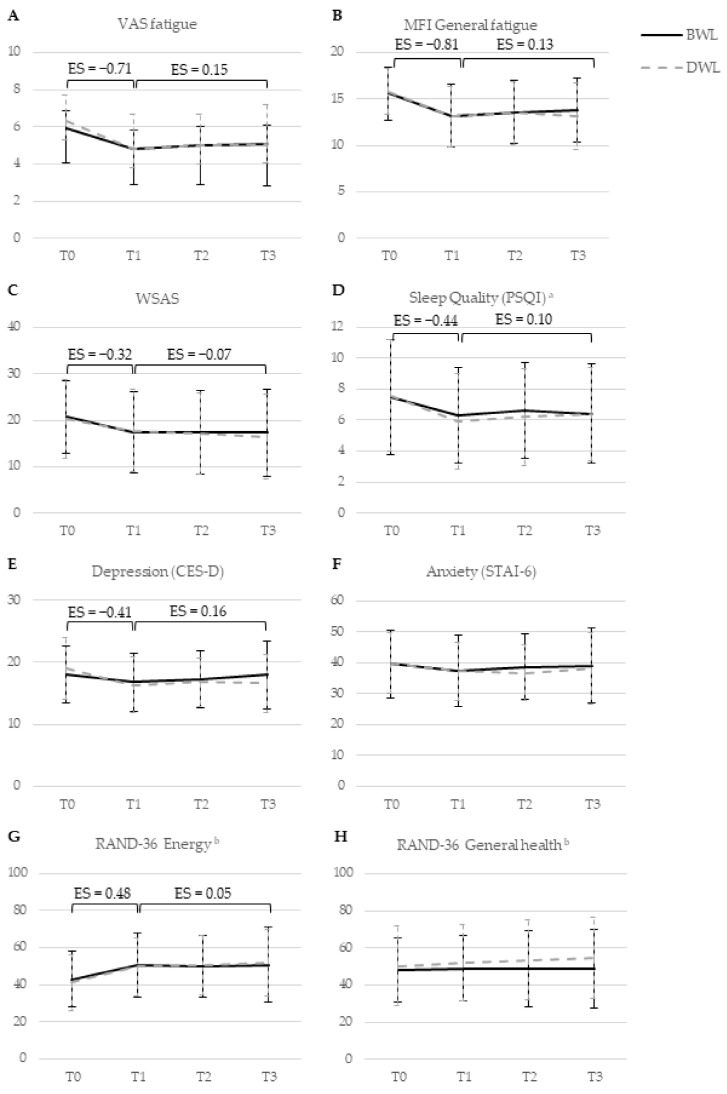
Figure 2.
Changes in raw mean levels of primary and secondary self-reported outcomes from baseline to nine months follow-up in groups receiving bright white light therapy (BWL; n = 83) and dim white light therapy (DWL; n = 83). Bars indicate standard deviations. Effect sizes are shown for significant changes over time in all participants, irrespective of light intensity. Abbreviations: BWL, bright white light; CES-D, Center for Epidemiological Studies—depression; DWL, dim white light; MFI, Multidimensional Fatigue Inventory; PSQI, Pittsburgh Sleep Quality Index; RAND-36, RAND 36-item Health Survey; STAI-6, State Trait Anxiety Index—short form; VAS, fatigue visual analogue scale; WSAS, Work and Social Adjustment Scale. T0, baseline; T1, directly post-intervention; T2, 3 months after the end of light therapy; T3, 9 months after finishing light therapy. a The total score of the PSQI is shown. Based on the AIC and BIC criteria, the model with the best fit excluded a random slope and included an autoregressive covariance structure. The effect of light therapy on the seven subscales of the PSQI is described in Supplementary material 6. b The energy and general health subscales of the RAND-36 are shown. The remaining subscales are described in Supplementary material Table S5.1.

