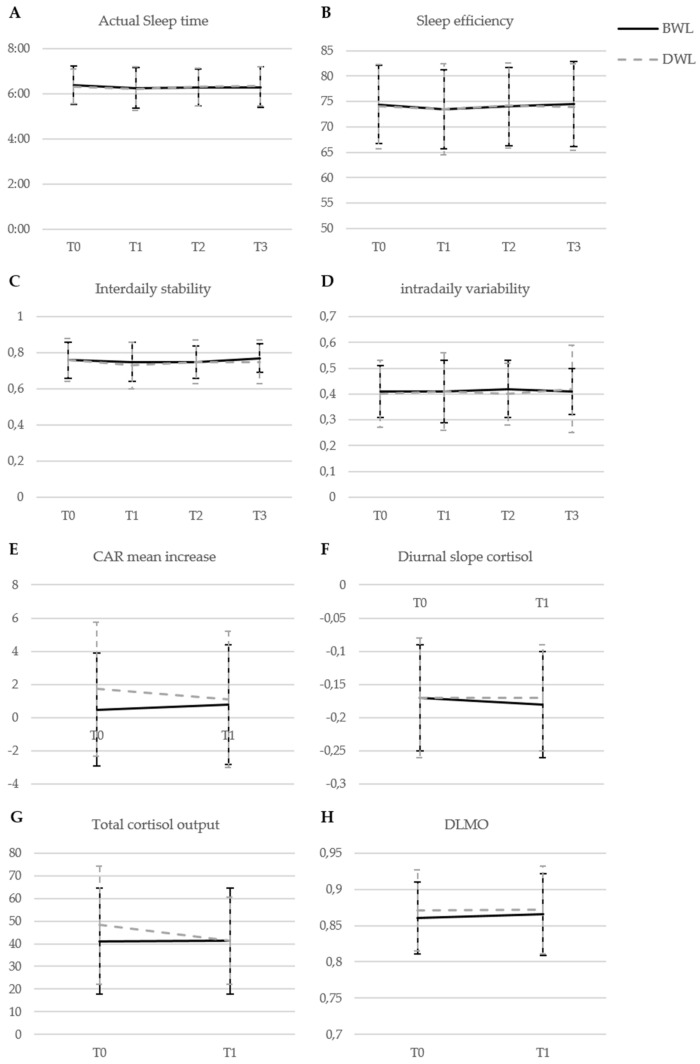
Figure 3.
Changes in raw mean levels of actigraphy-derived sleep variables (A–D), cortisol, and melatonin variables (E–H) in groups receiving bright white light therapy (BWL; n = 83) and dim white light therapy (DWL; n = 83). Bars indicate standard deviations. Abbreviations: BWL, bright white light; CAR, cortisol awakening response; DLMO, dim light melatonin onset; DWL, dim white light; T0, baseline; T1, directly post-intervention; T2, 3 months after the end of light therapy; T3, 9 months after finishing light therapy.

