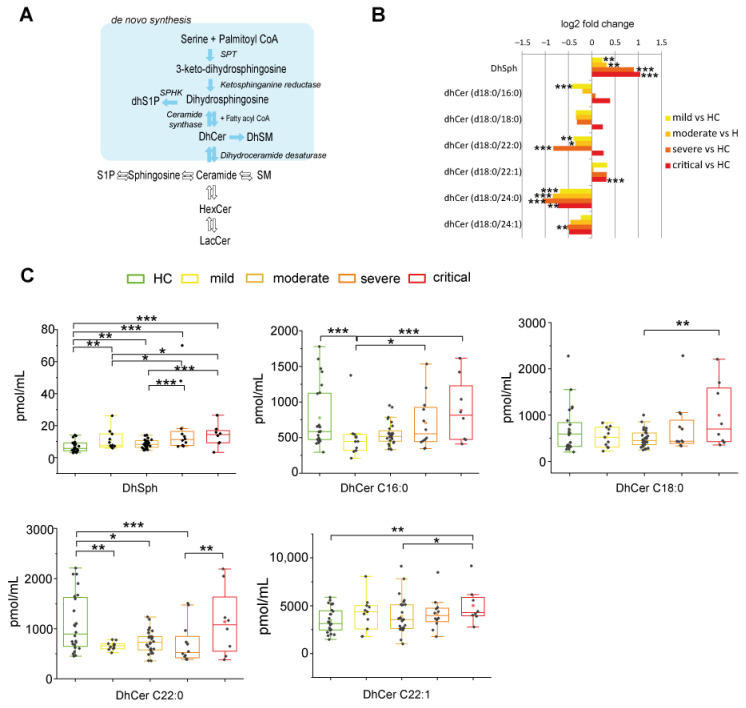
Figure 2.
Serum sphingolipid changes related to COVID-19 in de-novo synthesis pathway. (A) Close up of de novo synthesis pathway, highlighted in light blue. (B) Log 2 fold changes in the median values of DhSph and DhCers in COVID-19 severity groups vs. healthy controls (HC). (C) Box plots of DhSph, DhCer C16:0, DhCer C18:0, DhCer C22:0, and DhCer C22:1 serum levels, according to COVID-19 severity. Box plots and whiskers represent the interquartile range with median value (central line) and the lowest and largest data point measured, respectively. Each measurement was performed in triplicate. Data were analyzed using Kruskal-Wallis ANOVA, followed by Dunn’s post hoc test for multiple comparisons. * p-value < 0.05, ** p-value < 0.01, *** p-value < 0.001.

