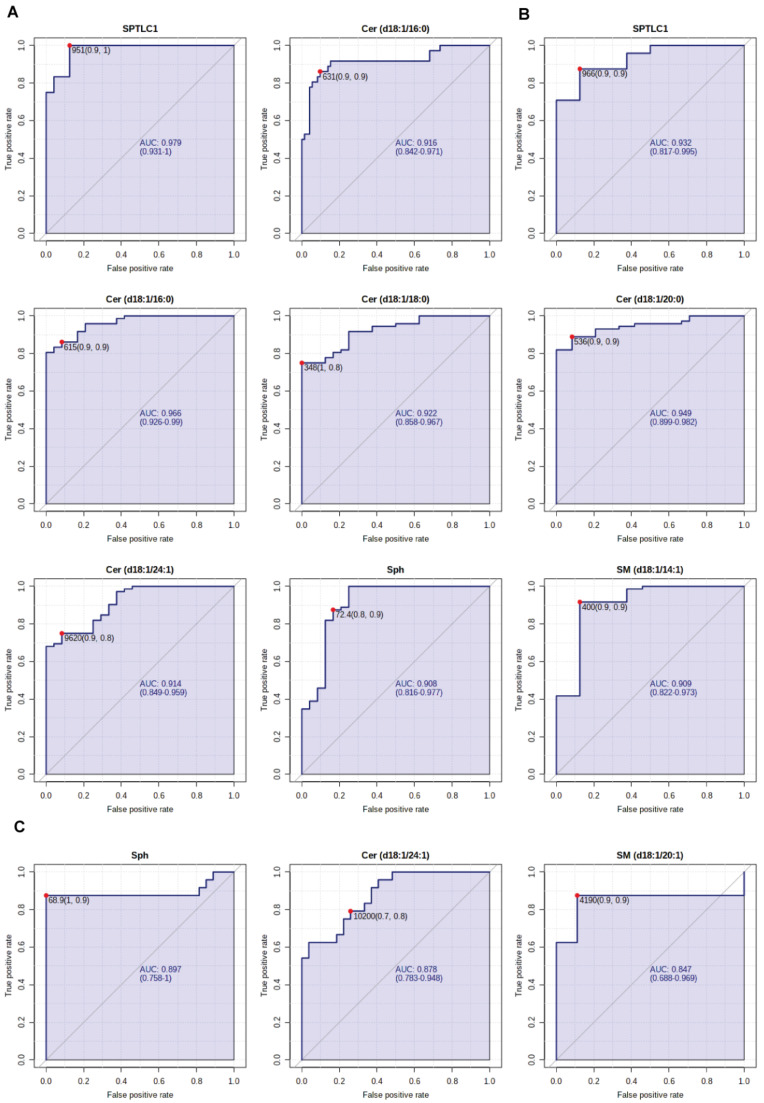
Figure 9.
(A) ROC curve analyses of SPTLC1 and Cer C16:0 for patients with severe COVID-19 disease and HC subjects; (B) ROC curve analyses of SPTLC1, Cers C16:0, C18:0, C20:0, C24:1, Sph, SM C14:1 for patients with critical COVID-19 disease and HC subjects; (C) ROC curve analyses of Sph, Cer C24:1, SM C20:1 for patients with critical and mild COVID-19 disease. AUC values and 95% confidence intervals are reported, as well as cut-off values and sensitivity and specificity values in brackets.

