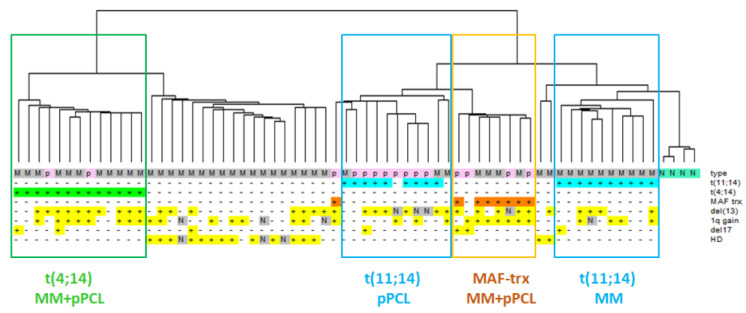
Figure 1.
Hierarchical clustering analysis of gene-expression profiles of 50 MM (grey), 15 pPCL (pink) and 4 N samples (green). Samples are grouped according to the expression levels of the 2402 most variable transcripts (varying at least 2-fold in expression levels from the mean across the dataset). Main molecular alterations are shown; N indicates data not available. The specific types (N = normal control, M = MM, p = pPCL) are enriched by colored sub-branches, also highlighted by the appropriately colored box (see text).

