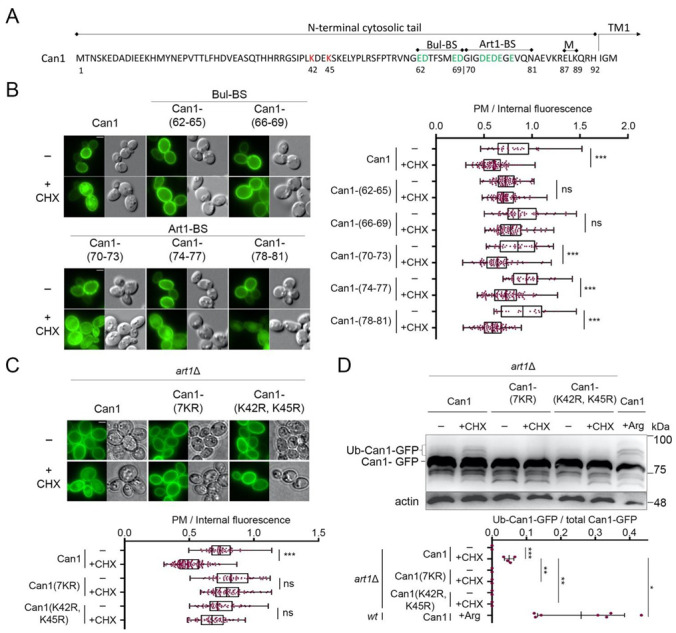
Figure 3.

Cycloheximide-induced endocytosis of Can1 requires Lys42 and Lys45 residues and an intact putative Bul-BS at the permease N-tail. (A) Amino acid sequence of the N-terminus of Can1. The main Ub-acceptor Lys42 and Lys45 are highlighted. Residues 62–69 and 70–81 have been identified as the putative binding sites of the Bul1/2 and Art1 α-arrestins, respectively. These sequences are enriched in negatively charged amino acids (highlighted in green). Residues 87–89, previously shown to be important for masking the Art1-BS in the outward-facing conformation [29], are also highlighted. (B) Epifluorescence microscopy of strains expressing wt Can1-GFP or Can1-GFP mutants carrying Ala-substitutions at the indicated residues of the N-tail. These residues of Can1 comprise the probable binding sites for Art1 (Art1-BS) or Bul1/2 (Bul-BS). Strains were grown on Gal, Am MM, Glu was added for 60 min and then CHX for 3 h before imaging, as in Figure 2A. Quantifications: Plasma membrane (PM) to internal GFP fluorescence intensity ratios are plotted (n = 25–101 cells). Quantifications, representations and scale bar as in Figure 2A. (C) Epifluorescence microscopy of art1Δ cells expressing Can1-GFP or the indicated Lys-to-Arg substitution alleles. Glu was added for 90 min and then CHX for 3 h before imaging, as in Figure 2A. Quantifications: Plasma membrane (PM) to internal GFP fluorescence intensity ratios are plotted (n = 70–135 cells). Quantifications, representations and scale bar as in Figure 2A. (D) art1Δ cells expressing the indicated Can1-GFP alleles were grown on Gal, Am MM. Glu was added for 30 min, a non-treated sample was collected (-) and then CHX or Arg was added for 30 or 20 min, respectively. Total protein extracts were probed and analysed as in Figure 2B. Lower exposure is provided in supporting information. The low mobility bands correspond to Ub-Can1-GFP conjugates. Quantifications: The ratio of Ub-Can1-GFP/Total Can1-GFP are plotted in scattered plots. Red dots represent the individual biological replicates. ***, p < 0.001; **, 0.001 < p < 0.01; * 0.01 < p < 0.05; ns, nonsignificant, p > 0.05.
