FIG 5.
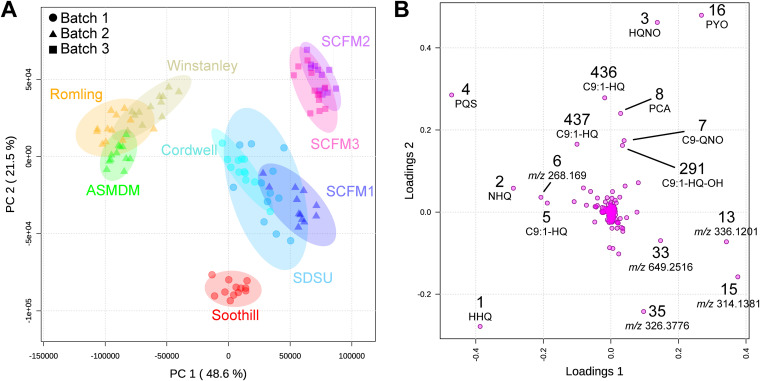
Principal-component analysis and its loadings plots of untargeted metabolomics data of PAO1 grown in ASM formulations. (A) Principal-component analysis scores plot of PAO1 samples, colored by medium and drawn with 95% confidence ellipses. The three processing batches are indicated by shapes. Data points representing the 12 replicate samples per medium were closely clustered and distinct clusters were observed for metabolite profiles from cultures in (i) Romling, Winstanley, and ASMDM ASM; (ii) SCFM2 and SCFM3; (iii) Cordwell, SDSU, and SCFM1 ASM; and (iv) Soothill ASM. (B) Loadings plot from untargeted LC-MS/MS-based principal-component analysis of PAO1 in ASM formulations. Features are labeled by their identification number from the feature quantification table and were identified using the FBMN results (Fig. 4). Features of unknown structure are labeled with their precursor mass. Features along the x axis (loadings 1) were responsible for the separation observed along the horizontal axis (PC1) of panel A. Features along the y axis (loadings 2) were responsible for the separation observed along the vertical axis (PC2) of panel A.

