Figure 4.
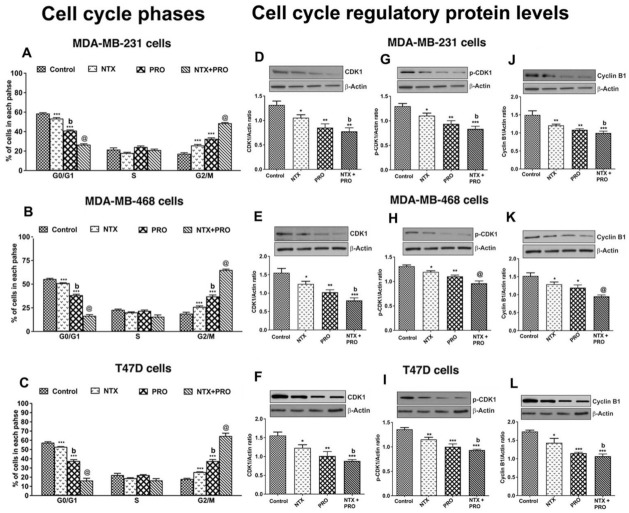
PRO and NTX increase G2/M arrest (A–C) and modulate levels of G2M-regulatory proteins (D–L) in MDA-MB-231, MDA-MB-468, and T47D cells. (A–C). Cells were treated with a 100 μM concentration of the drugs alone or in combination or vehicle alone for 48 h. After the treatment period, cells were stained with PI and analyzed for cell cycle distribution using flow cytometry. Proportions of cells in each phase were quantified and the values are shown as histograms. (D–L). After the drug treatments, some cells were extracted and used for Western blot analysis of CDK, phospho-CDK, and Cycline B1. Representative blots are presented on the top and mean densitometric values are presented as ratio of β-actin in the histograms. Data presented are mean ± SEM (n = 5–6 samples/group) and were analyzed using one-way ANOVA with the Newman–Keuls multiple comparisons post hoc test. *, p < 0.05, **, p < 0.01, ***, p < 0.001 compared to control, b, p < 0.05, compared with NTX. @, p < 0.05, compared with the rest of the groups. (Figure S3: Original gel blots).

