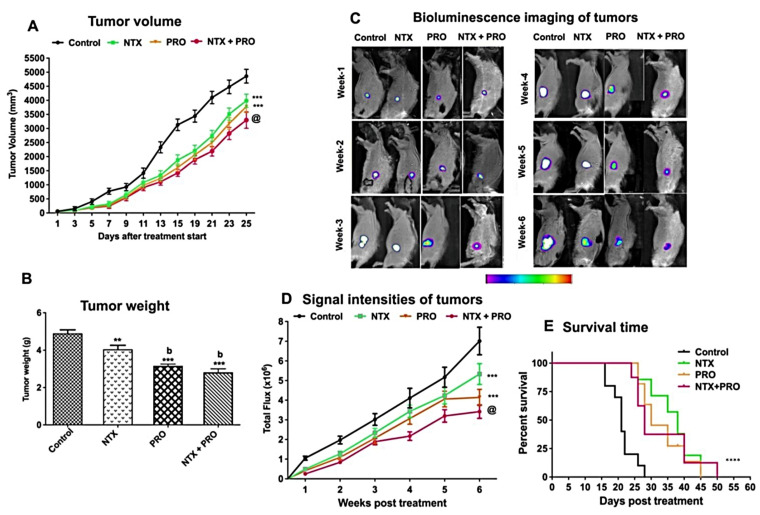
Figure 6.
PRO and NTX decrease tumor growth and increase survival in MDA-MB-231-cell-derived xenografts in nude rats. (A) Changes in the tumor volume following drug treatments. Values are mean ± SEM (n = 8/group). Comparison of tumor volume between groups was performed by two-way ANOVA with Bonferroni’s multiple comparisons test. ***, p < 0.001 vs. control. @, p < 0.001, compared with the rest of the groups. (B) Tumor weight (mean ± SEM; n = 5/group) of control and drug-treated rats. Comparison of tumor weight between groups was analyzed by one-way ANOVA with the Newman–Keuls post hoc test. **, p < 0.01, ***, p < 0.001 vs. control. b, p < 0.01, compared with NTX. (C) Representative photograph of nude rats injected with MDA-MB 231/Luc-GFP cells and treated with various drug combinations and monitored for a period of 6 weeks by using bioluminescence imaging. Relative intensities of emitted light are represented as a pseudocolor image ranging from purple (least intense) to white (most intense), generated in living image and superimposed onto the grayscale reference image. (D) The signal intensity (SI) is expressed as photon flux (photo/sec) from the tumor (mean ± SEM; n = 6/group). Comparison of photon flux between groups was performed by two-way ANOVA with Bonferroni’s multiple comparisons test. ***, p < 0.001 vs. control. @, p < 0.001, compared with the rest of the groups. (E) Effects on survival time (days after tumor cell injection) of nude rats inoculated with MDA-MB-231 cells. Kaplan–Meier survival analysis was used to test significant differences between survival curves and mean survival time for rats from each group. Multiple comparisons of survival curves were performed with the Log-rank (Mantel–Cox) test (****, p ≤ 0.001 compared to control).

