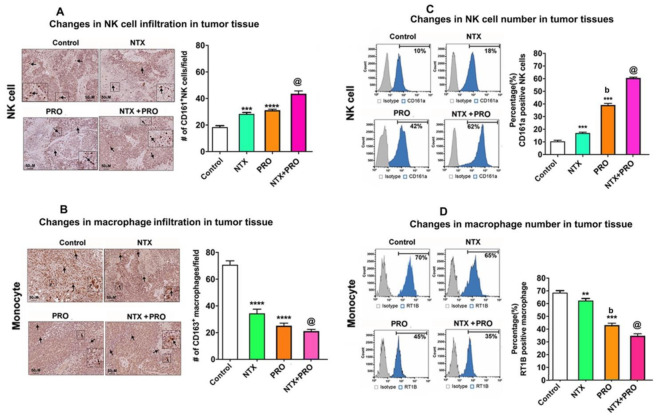
Figure 9.
Beta-adrenergic and opioidergic agents alter immune cells in the tumor in breast cancer cell xenografted rats. (A,B) Left: Representative microscopic pictures of immunocytochemical staining demonstrating infiltration of CD161+ NK cells and CD163+ macrophages in tumor tissues in various treatment groups. Arrows indicate the staining of NK cells and macrophages. Scale bars are 50-µm. Inset in each figure shows a magnified view of representative NK cells and macrophages. Right: Histograms showing numbers of tumor infiltrated NK cells and macrophages quantified from six different fields and presented as mean ± SEM (n = 5–6 animals/group). (C,D) Left: Fluorescence histograms showing the percentages of CD161a-expressing NK cells and MHC class II CRT1B-expressing macrophages from tumor tissues of control and treated rats. Data are shown for isotype control (gray) and specific cell surface marker (blue). Right: The bar graphs show the mean ± SEM (n = 5–6 animals/group) percentage NK cells and macrophages as determined from single-color (parameter) flow cytometry histogram. **, p < 0.01, ***, p <0.001, ****, p <0.0001 compared to control, b, p < 0.05, compared with NTX treatment. @, p < 0.05, compared with the rest of the treatment groups.

