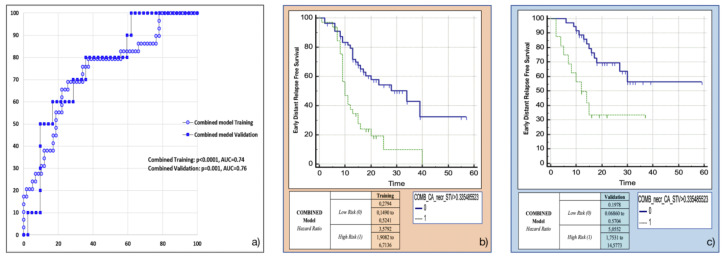
Figure 6.
Combined model overall performance in terms of (a) area under the ROC curve (AUC) for both training (blue empty circles) and validation (blue filled squares) cohorts, and outcome prediction in terms of Kaplan Meier curve separation between low and high risk patients according to the computed prognostic index in both training (b) and validation (c) cohorts.

