Figure 6.
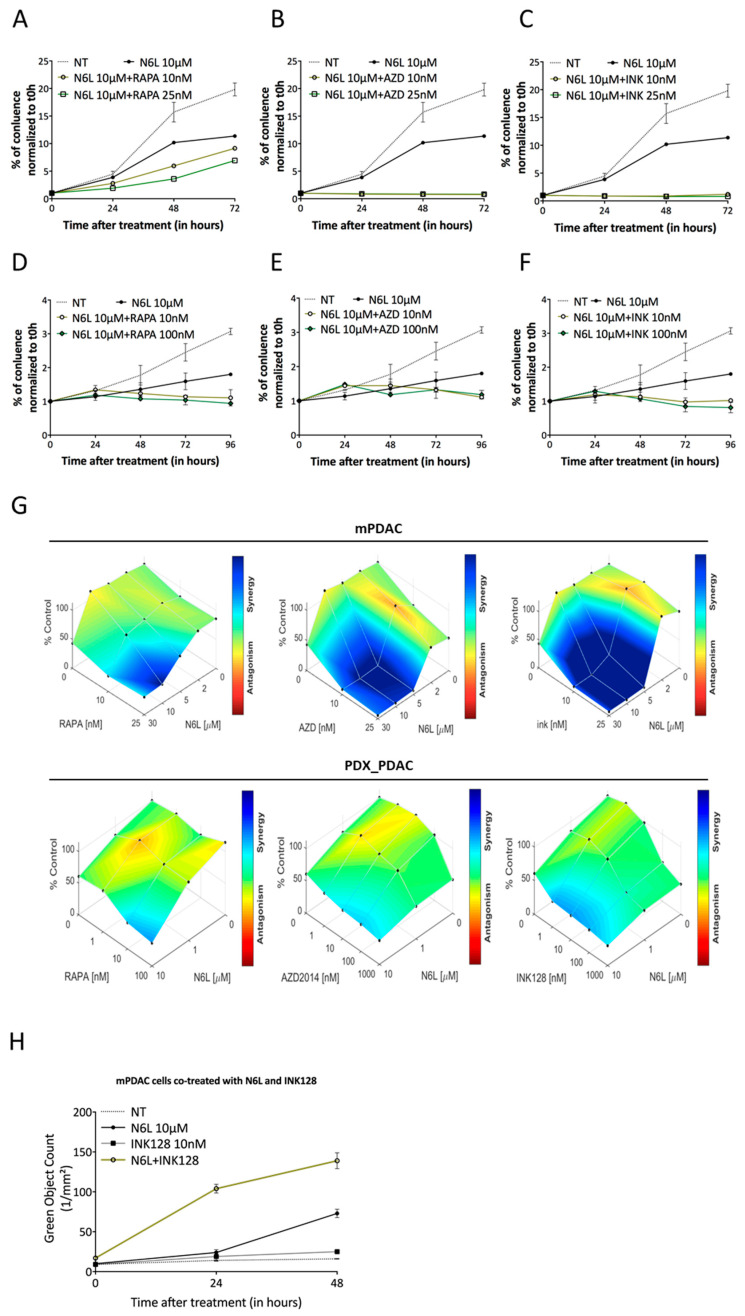
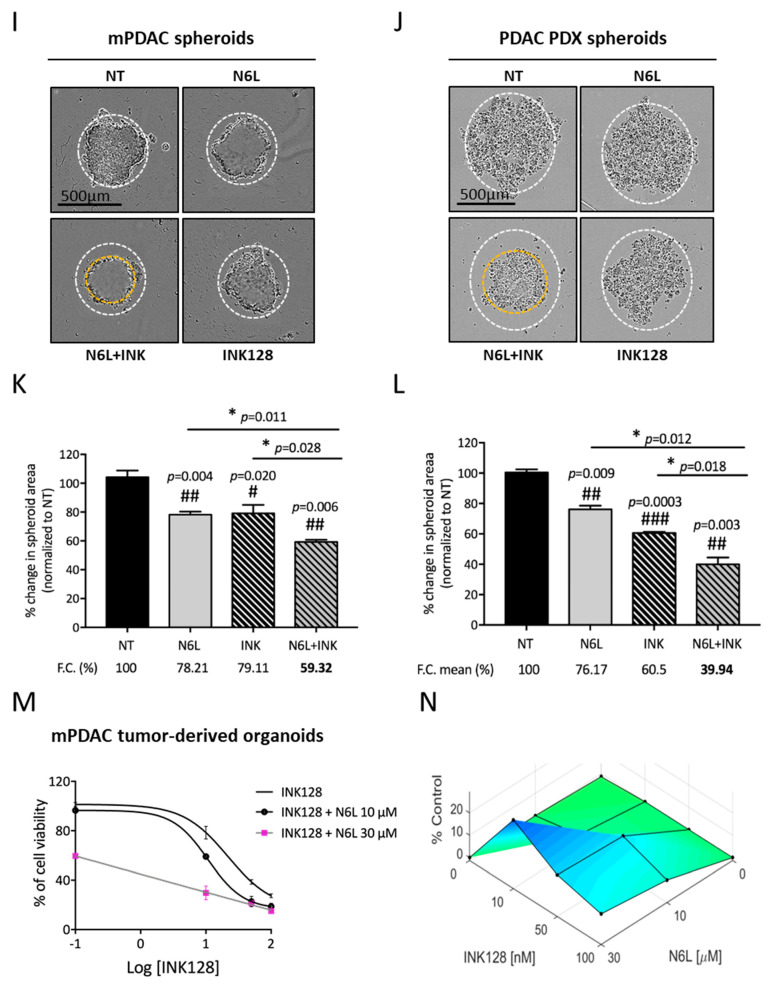
N6L and mTORi combination acts synergistically to decrease PDAC cell and spheroid growth and organoid viability. (A–C), mPDAC cell lines were seeded in 96-well plates and allowed to adhere overnight. Cells were treated with 10 or 25 nM of rapamycin (RAPA, A), AZD2014 (AZD, B), or INK128 (INK, C) in combinations with N6L at 10 µM over 72 h. (D–F), PDAC PDX (PAN014) cell lines were seeded in 96-well plates and allowed to adhere for 2 days. Cells were treated with 1, 10, or 100nM of RAPA, AZD, or INK in combinations with N6L at 10 µM over 96 h. Cell growth was assessed by IncuCyte ZOOM® (Michigan, USA) live-imaging. The AUC (area under curves) was calculated by IncuCyte ZOOM® live-imaging software. Growth for treated cells was normalized to untreated cells on the same plate. (G)—Synergy/antagonism calculation. The contour views from the LOEWE model were selected as graphical outputs for the synergy distribution. (H), Apoptosis induction assay is performed with mPDAC incubated with 10 µM of N6L alone or in combination with 10 nM of INK128 using InCucyte ZOOM live imaging system. Data are represented showing the number of caspase-3/7 positive cells (green color object) per surface (mm2). (I,J), Representative images of mPDAC (I) and PDAC PDX (J) spheroids non-treated (NT) or treated with N6L alone or combined with INK128 over 96 h. (K–L), Spheroid area was calculated using ImageJ software, and data were normalized to control for combinations of N6L and INK128. (M), mPDAC organoid viability assessed with MTS assay upon treatment with INK128 alone or in combination with N6L at 10 µM and 30 µM. (N), Contour view showing the synergy distribution from MTS assay on mPDAC organoid. Scale bar, 500 µm. (#) if comparing each treatment to NT, (*) if comparing the combination to a single treatment. * p < 0.05; ** p < 0.01; and n.s. for not statistically significant, as determined by Student’s t-test on the final data point.


