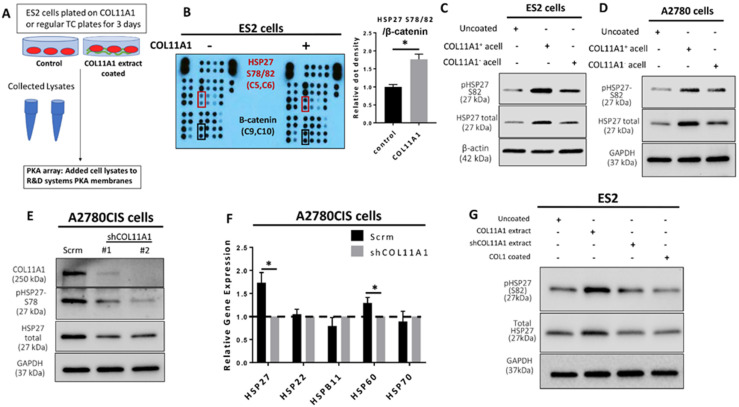
Figure 1.
COL11A1 induces HSP27 phosphorylation and total expression in ovarian cancer cells. (A) Schematic of the Protein Kinase array (PKA) experiment set up. (B) Image and quantification of the PKA result. Red boxes on the image indicates the position of the HSP27 S78/82 antibody epitopes, and black boxes indicate the β-catenin epitopes. Coordinates for the HSP27 S78/82 epitopes and β-catenin on membranes are listed below the protein name in parentheses. Bar graph shows quantification of the HSP27 (S78/82) dot densities normalized to β-catenin. (C) Western blot of the phosphorylated (at S82) and total HSP27 in ES2 cultured on COL11A1-positive and -negative A204-derived decellularized matrices (referred to as acell) and control (uncoated) conditions. (D) Western blot of the phosphorylated (at S82) and total HSP27 in A2780 cells cultured on COL11A1-positive and -negative A204-derived decellularized matrices and control conditions. (E) Western blot of phosphorylated (at S78) and total HSP27 in A2780CIS-scrm and A2780CIS-shCOL11A1. (F) Gene expression of HSP27 (HSPB1), HSP22 (HSPB8), HSPB11, HSP60 (HSPD1), and HSP70 (HSPA1A) in A2780CIS-scrm and A2780CIS-shCOL11A1 measured by RT-PCR. (G) Western blot of the phosphorylated (at S82) and total HSP27 in ES2 cultured on COL11A1-positive and -negative extracts and control conditions (n = 3). GAPDH and β-actin were used as the loading controls for the Western blots. All experiments were performed in the standard experiment conditions (cells cultured in the above conditions for 3 days in 1% FBS medium after overnight serum starvation). Error bars indicate the standard deviation. *, p value < 0.05. The uncropped Western blot figures are presented in Figure S5.

