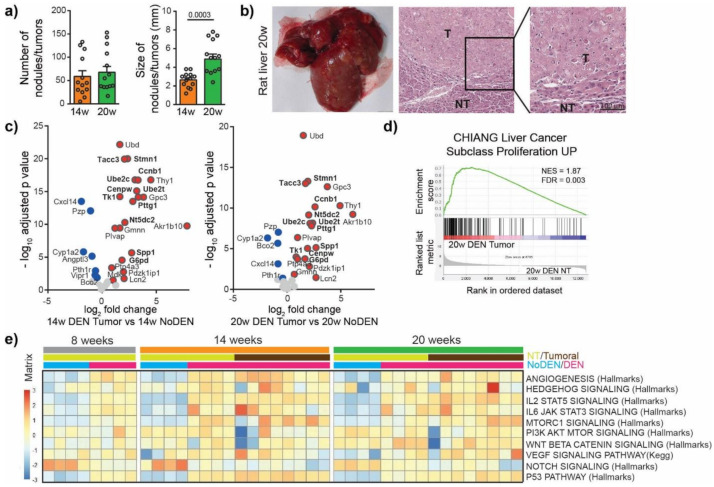
Figure 3.
DEN-induced rat model of HCC shows genetic and molecular similarities with human HCC. (a) Macroscopic examination of livers with assessment of tumor number at the surface of livers and tumor size (average of diameter of the five largest tumors). Each circle represents an individual animal, mean ± SE, n = 13/group. Comparison of means was performed by unpaired t test. (b) Representative picture of rat liver at 20 w and representative images of hematoxylin and eosin (H&E)-stained sections proving HCC, (20× magnification). T = tumor, NT = Non-tumor tissue. (c) Volcano plot displaying differential gene expression in tumors at 14 w (left) and 20 w (right) by RNA-seq. The log-transformed adjusted p-values are plotted on the y-axis and log2 fold change values on the x-axis, with the threshold for a relative expression fold change ≤ −0.5 or ≥ 0.5 and adjusted p ≤ 0.05. Significantly over-expressed genes (red circles) and under-expressed genes (blue circles) in DEN-induced tumors based on top 25 over-expressed and top 25 under-expressed genes in human HCC. Only the top 25 over-expressed and top 25 under-expressed genes in human HCC are shown in this volcano plot. Genes whose high expression is associated with unfavorable prognosis in human liver cancer are marked in bold. (d) Gene Set Enrichment Analysis (GSEA) of RNA-seq data from 20 w DEN tumor tissue showing the enrichment of genes associated with human liver cancer subclass characterized by increased proliferation. NES = normalized enrichment score; FDR = false discovery rate. w = weeks. (e) Heatmap showing the single-sample GSEA scores for gene sets classically associated with the development of human HCC.

