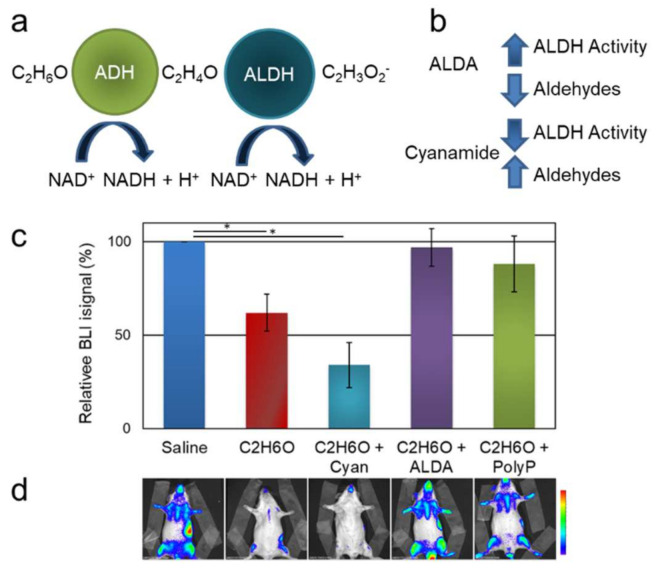
Figure 3.
Effects of pharmacological treatments on NF-Y-dependent cell proliferation in MITO-Luc mice administered C2H6O. (a) Illustration of the metabolism of ethanol into acetaldehyde and acetate. ADH: alcohol dehydrogenase; ALDH: aldehyde dehydrogenase. (b) Schematic representation of the effects of pharmacological treatment with the ALDH inhibitor cyanamide or the activator ALDA. (c) Quantification of the BLI signals relative to the control (saline) group in animals administered C2H6O treated either with cyanamide, ALDA, or the antioxidant compound Phenolea Active Complex (PolyP). (d) Representative BLI analysis in one mouse per group at approximately 10 days after treatment. The pseudo-color scale bar indicates the relative signal intensity from the lowest (blue) to the highest (red) (range 1 × 10⁴–1 × 10⁵ photons/s/cm2/sr). The asterisk (*) indicates a statistically significant difference between the indicated groups (p ≤ 0.05).

