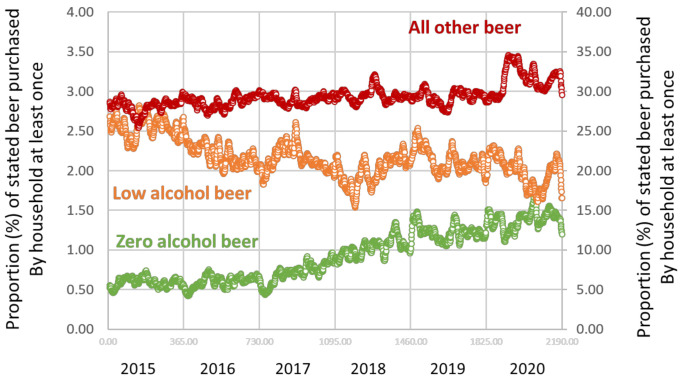
Figure 1.
Proportion (%) of households that reported at least one purchase of zero alcohol beer (green, left vertical axis), low alcohol beer (orange, left vertical axis) and all other beer (red, right vertical axis) for any day that a household made an alcohol purchase by study day, 2015 to 2020. Data points: daily.

