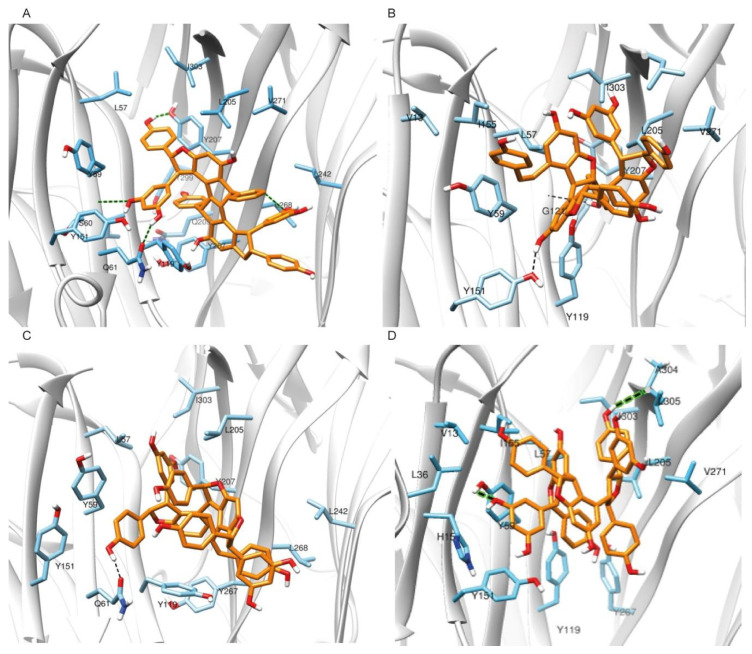
Figure 6.
Main interactions between the compounds and the TNF binding cavity residues after 1000 ns MD simulation. Schematic representation of (A) Nepalensinol B; (B) Miyabenol A; (C) Flexuosol A and (D) Kobophenol A, when bound to the TNF cavity. Average conformations of the ligands within the cavity, along with protein residues that are involved in hydrogen bond interactions with the compounds are shown with black dashed lines, and green dashed for further clarification.

