Figure 3.

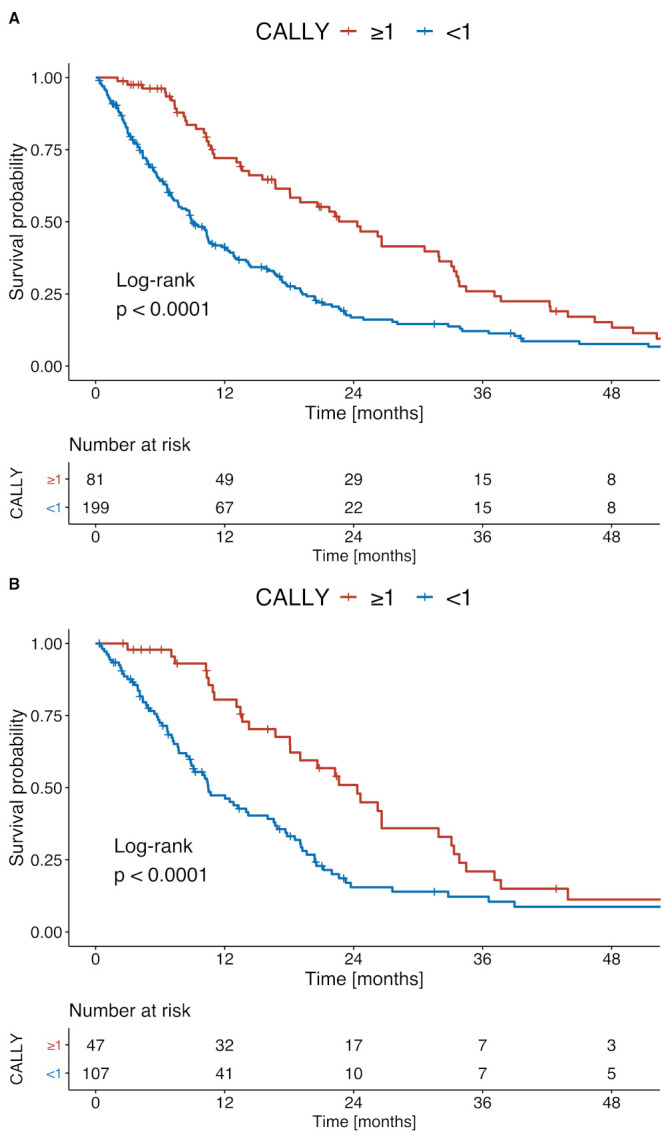
Kaplan–Meier survival curves comparing patients with low and high CALLY scores among (A) all patients and (B) patients classified as BCLC B.

Kaplan–Meier survival curves comparing patients with low and high CALLY scores among (A) all patients and (B) patients classified as BCLC B.