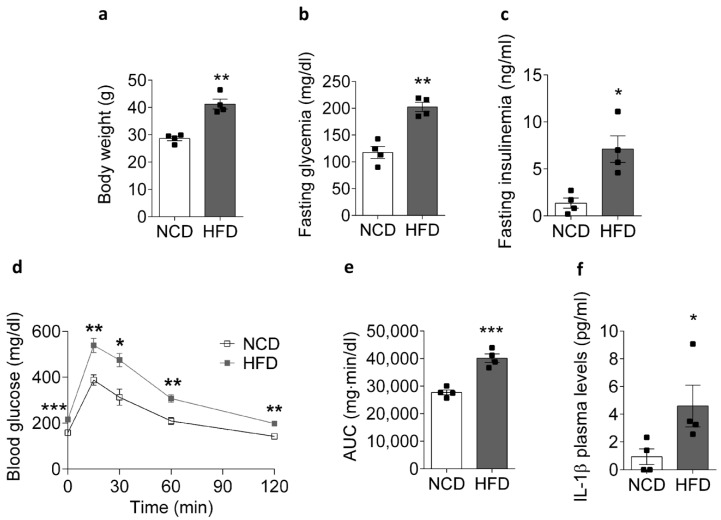
Figure 1.
Physiological and metabolic parameters of NCD- and HFD-fed mice. Comparison of (a) body weight, (b) fasting blood glucose, (c) plasma insulin, (d) intraperitoneal glucose tolerance test, (e) area under the glucose curve, and (f) IL-1β in mice fed for 8 weeks with an NCD or HFD. Data are shown as the mean ± SEM. * p < 0.05 (n = 4), ** p < 0.01, and *** p < 0.001 vs. HFD. NCD, normal control diet; HFD, high-fat diet.

