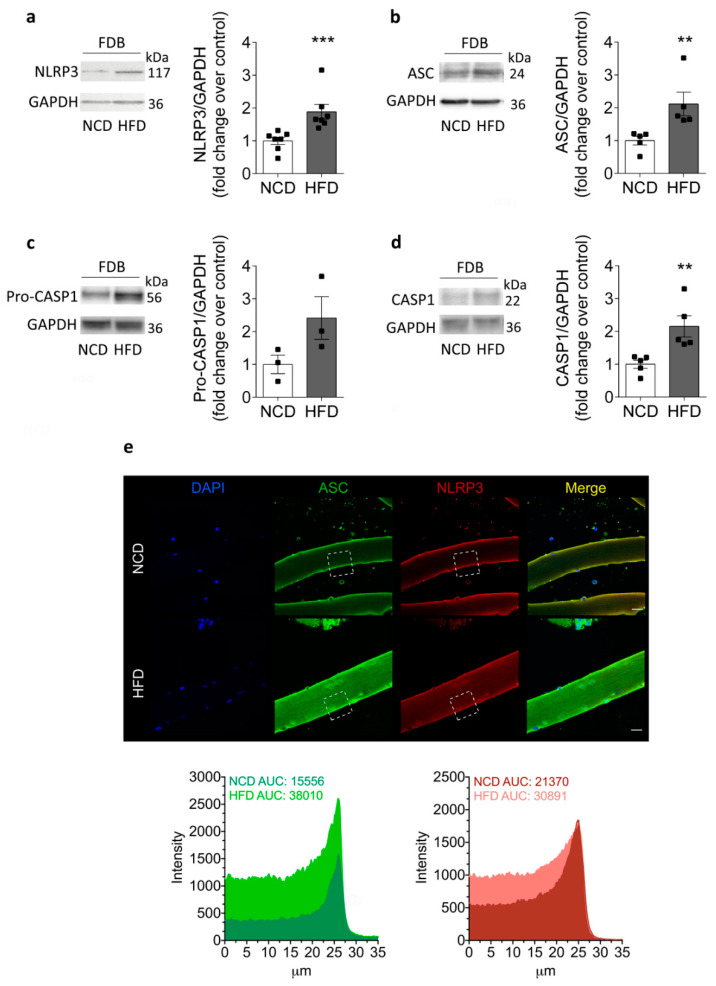
Figure 3.
NLRP3 inflammasome protein content and localization in the skeletal muscle from HFD compared to NCD-fed mice. Representative Western blot and quantification showing (a) NLRP3, (b) ASC, (c) pro-caspase-1, and (d) caspase-1 protein content in homogenates. The samples were prepared from FDB muscle isolated from NCD- or HFD-fed mice after 8 weeks of an HFD. GAPDH was used as a housekeeping loading control. Each lane was loaded with 60 μg of total protein. Values represent the mean ± SEM (n = 3–7). ** p < 0.01 and *** p < 0.001, determined by Student’s t-test. (e) Representative confocal images of isolated adult FDB fibers from NCD- and HFD-fed mice illustrate the localization of ASC (green) and NLRP3 (red). DAPI staining of the nuclei is shown in blue. The area under curve (AUC) was measured on white squares, and quantified as fluorescence intensity. Scale bar: 20 μm.

