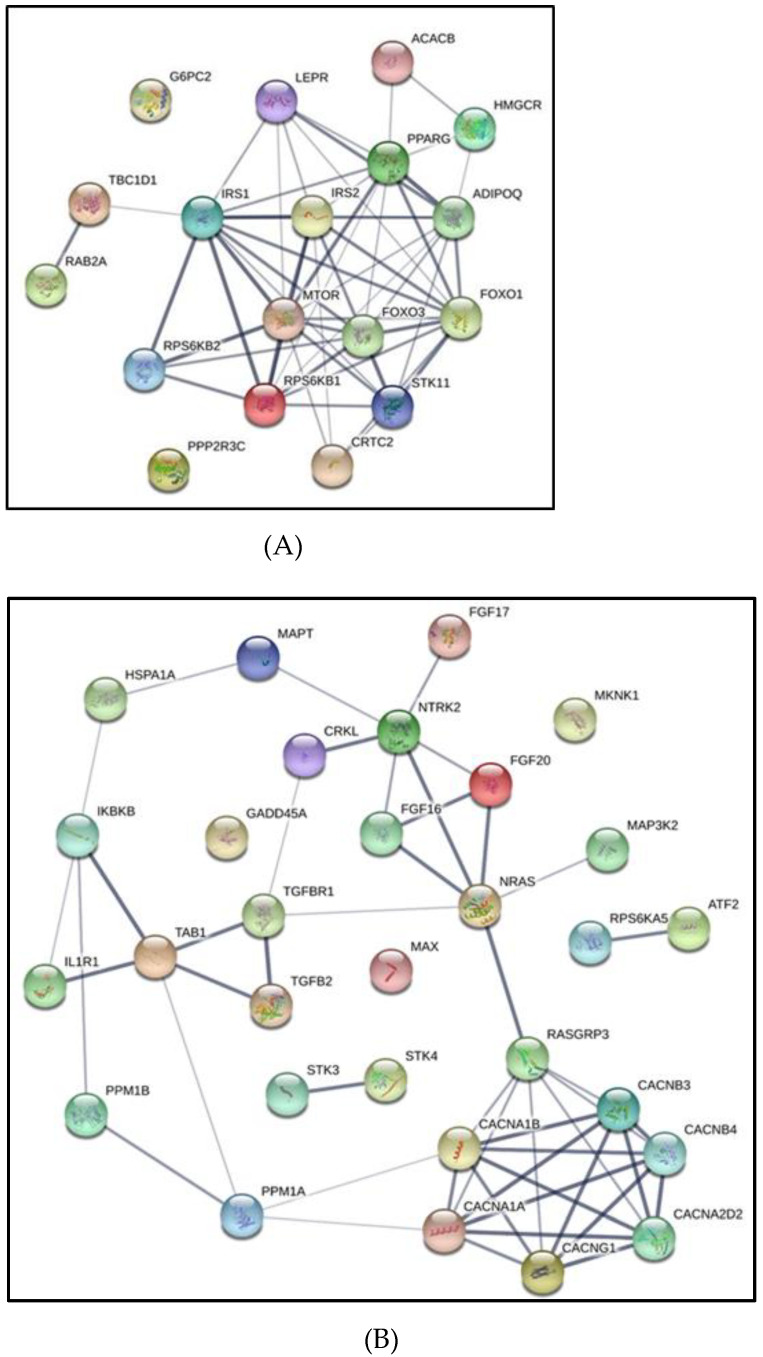
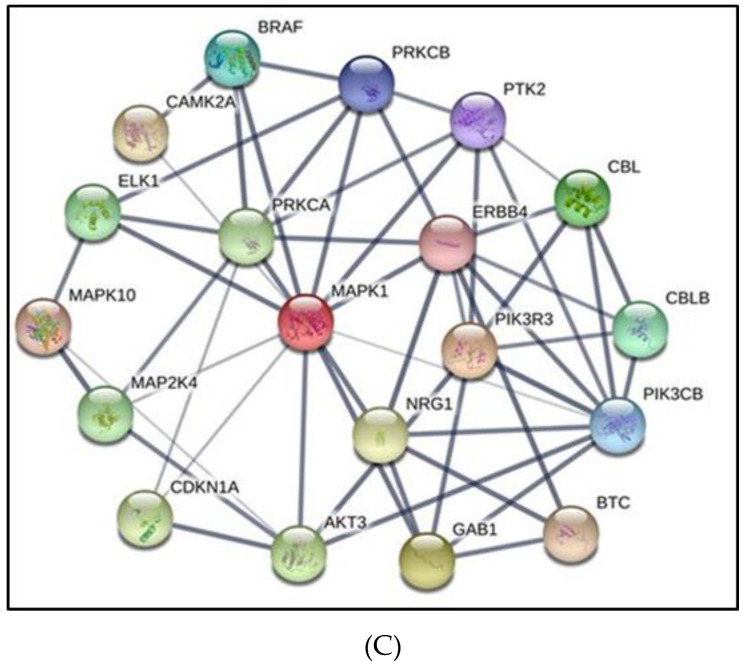
Figure 6.
Gene network representation of interactions between gene target predictions of exosomal-miRNAs derived from melanoma cells (CRL-1424) exposed to normoxia or IH conditions. Three gene networks were generated from gene lists presented in Table 1. Panel (A) represents the gene network for the AMPK pathway, Panel (B) MAPK pathway, and Panel (C) cAMP pathway.


