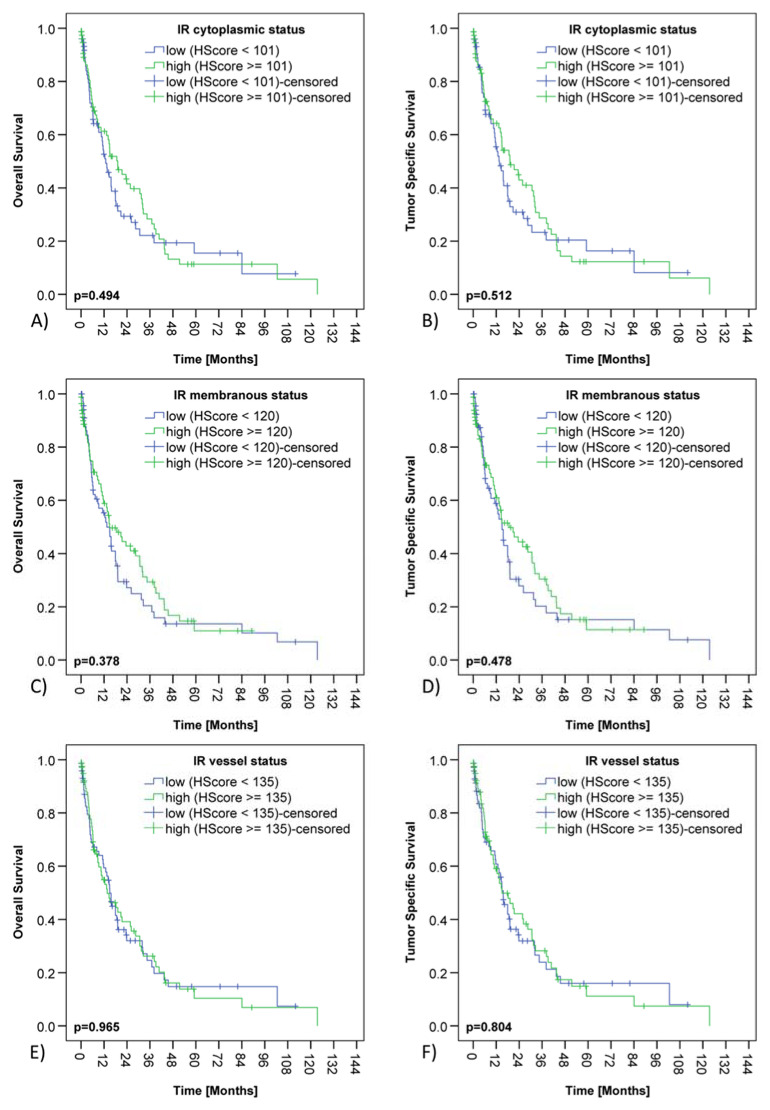
Figure 3.
Insulin receptor expression and survival of PDAC patients. Kaplan–Meier curves demonstrating correlations between cytoplasmic insulin receptor expression in cancer cells (cCC-IR) and overall (A) (p = 0.494) as well as tumor specific survival (B) (p = 0.512). Kaplan–Meier curves showing correlations between membranous insulin receptor expression in tumor cells (mCC-IR) and overall (C) (p = 0.378) as well as tumor specific survival (D) (p = 0.478). Kaplan–Meier curves depicting correlations between insulin receptor expression in tumor vasculature (VIR) and overall (E) (p = 0.965) as well as tumor specific survival (F) (p = 0.804).

